Tohono O'odham vs Immigrants from Norway Cognitive Disability
COMPARE
Tohono O'odham
Immigrants from Norway
Cognitive Disability
Cognitive Disability Comparison
Tohono O'odham
Immigrants from Norway
19.3%
COGNITIVE DISABILITY
0.0/ 100
METRIC RATING
341st/ 347
METRIC RANK
17.0%
COGNITIVE DISABILITY
90.9/ 100
METRIC RATING
137th/ 347
METRIC RANK
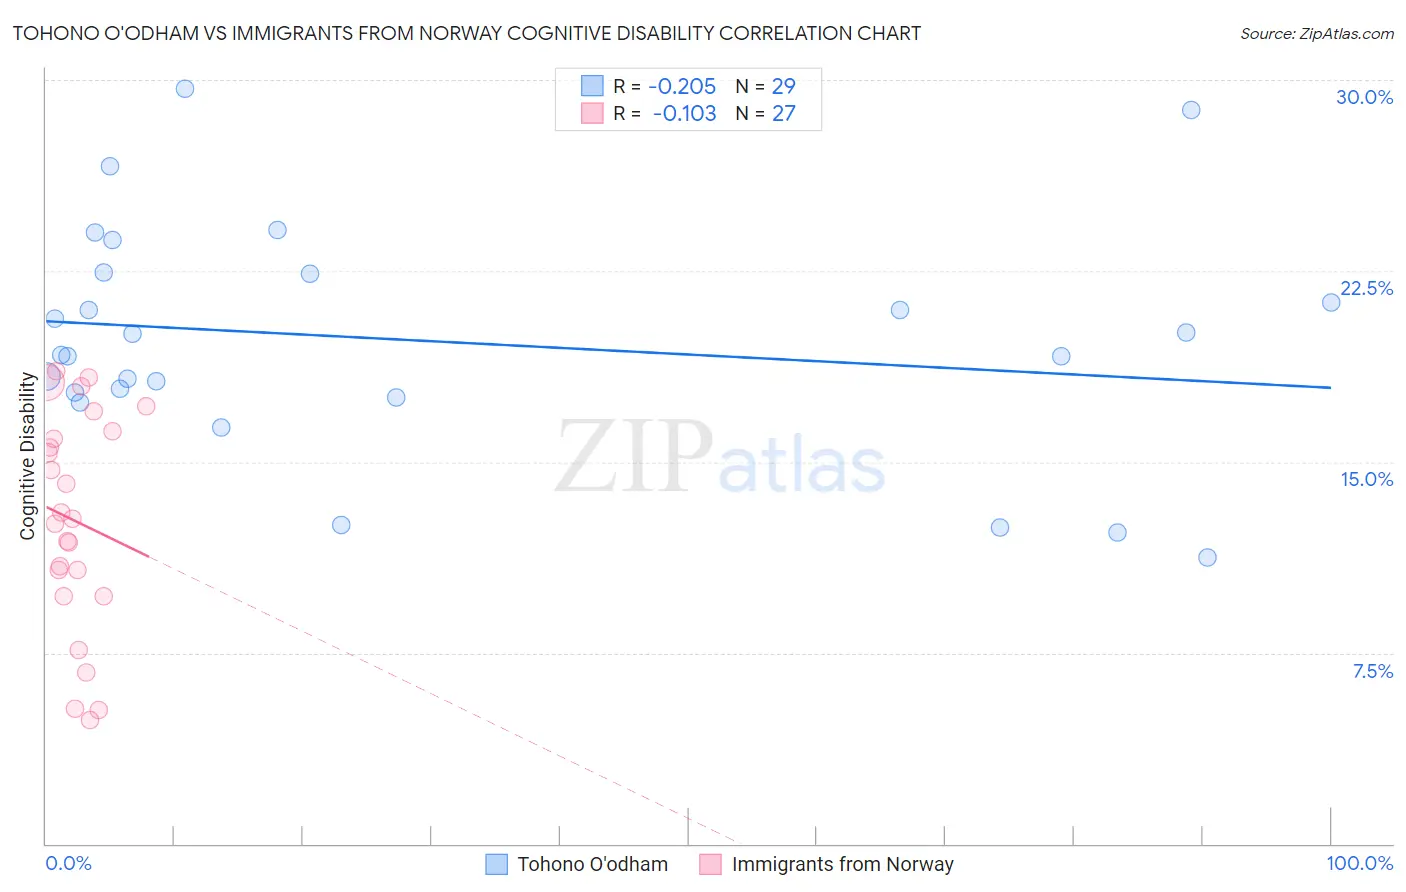
Tohono O'odham vs Immigrants from Norway Cognitive Disability Correlation Chart
The statistical analysis conducted on geographies consisting of 58,725,044 people shows a weak negative correlation between the proportion of Tohono O'odham and percentage of population with cognitive disability in the United States with a correlation coefficient (R) of -0.205 and weighted average of 19.3%. Similarly, the statistical analysis conducted on geographies consisting of 116,706,385 people shows a poor negative correlation between the proportion of Immigrants from Norway and percentage of population with cognitive disability in the United States with a correlation coefficient (R) of -0.103 and weighted average of 17.0%, a difference of 13.4%.
Cognitive Disability Correlation Summary
| Measurement | Tohono O'odham | Immigrants from Norway |
| Minimum | 11.2% | 4.9% |
| Maximum | 29.7% | 18.5% |
| Range | 18.4% | 13.7% |
| Mean | 19.8% | 12.7% |
| Median | 19.2% | 12.7% |
| Interquartile 25% (IQ1) | 17.6% | 9.7% |
| Interquartile 75% (IQ3) | 22.4% | 16.2% |
| Interquartile Range (IQR) | 4.8% | 6.5% |
| Standard Deviation (Sample) | 4.5% | 4.2% |
| Standard Deviation (Population) | 4.4% | 4.2% |
Similar Demographics by Cognitive Disability
Demographics Similar to Tohono O'odham by Cognitive Disability
In terms of cognitive disability, the demographic groups most similar to Tohono O'odham are Houma (19.3%, a difference of 0.0%), Cape Verdean (19.2%, a difference of 0.24%), Puerto Rican (19.2%, a difference of 0.26%), Immigrants from Zaire (19.4%, a difference of 0.69%), and Lumbee (19.1%, a difference of 0.74%).
| Demographics | Rating | Rank | Cognitive Disability |
| Immigrants | Yemen | 0.0 /100 | #333 | Tragic 18.8% |
| Sudanese | 0.0 /100 | #334 | Tragic 18.9% |
| Senegalese | 0.0 /100 | #335 | Tragic 19.0% |
| Blacks/African Americans | 0.0 /100 | #336 | Tragic 19.0% |
| Immigrants | Saudi Arabia | 0.0 /100 | #337 | Tragic 19.1% |
| Lumbee | 0.0 /100 | #338 | Tragic 19.1% |
| Puerto Ricans | 0.0 /100 | #339 | Tragic 19.2% |
| Cape Verdeans | 0.0 /100 | #340 | Tragic 19.2% |
| Tohono O'odham | 0.0 /100 | #341 | Tragic 19.3% |
| Houma | 0.0 /100 | #342 | Tragic 19.3% |
| Immigrants | Zaire | 0.0 /100 | #343 | Tragic 19.4% |
| Immigrants | Congo | 0.0 /100 | #344 | Tragic 19.7% |
| Somalis | 0.0 /100 | #345 | Tragic 19.8% |
| Immigrants | Cabo Verde | 0.0 /100 | #346 | Tragic 19.9% |
| Immigrants | Somalia | 0.0 /100 | #347 | Tragic 20.0% |
Demographics Similar to Immigrants from Norway by Cognitive Disability
In terms of cognitive disability, the demographic groups most similar to Immigrants from Norway are Israeli (17.0%, a difference of 0.0%), Welsh (17.0%, a difference of 0.020%), Lebanese (17.0%, a difference of 0.030%), Immigrants from Chile (17.0%, a difference of 0.070%), and French (17.0%, a difference of 0.080%).
| Demographics | Rating | Rank | Cognitive Disability |
| Immigrants | Vietnam | 92.4 /100 | #130 | Exceptional 17.0% |
| Immigrants | Germany | 92.1 /100 | #131 | Exceptional 17.0% |
| Whites/Caucasians | 92.1 /100 | #132 | Exceptional 17.0% |
| Immigrants | Jordan | 91.9 /100 | #133 | Exceptional 17.0% |
| Immigrants | Chile | 91.7 /100 | #134 | Exceptional 17.0% |
| Lebanese | 91.3 /100 | #135 | Exceptional 17.0% |
| Israelis | 91.0 /100 | #136 | Exceptional 17.0% |
| Immigrants | Norway | 90.9 /100 | #137 | Exceptional 17.0% |
| Welsh | 90.8 /100 | #138 | Exceptional 17.0% |
| French | 90.0 /100 | #139 | Excellent 17.0% |
| Chileans | 89.9 /100 | #140 | Excellent 17.0% |
| Aleuts | 89.9 /100 | #141 | Excellent 17.0% |
| Carpatho Rusyns | 89.6 /100 | #142 | Excellent 17.0% |
| British | 89.3 /100 | #143 | Excellent 17.0% |
| Immigrants | Brazil | 89.3 /100 | #144 | Excellent 17.0% |