Asian vs Immigrants from Norway Cognitive Disability
COMPARE
Asian
Immigrants from Norway
Cognitive Disability
Cognitive Disability Comparison
Asians
Immigrants from Norway
16.7%
COGNITIVE DISABILITY
98.7/ 100
METRIC RATING
94th/ 347
METRIC RANK
17.0%
COGNITIVE DISABILITY
90.9/ 100
METRIC RATING
137th/ 347
METRIC RANK
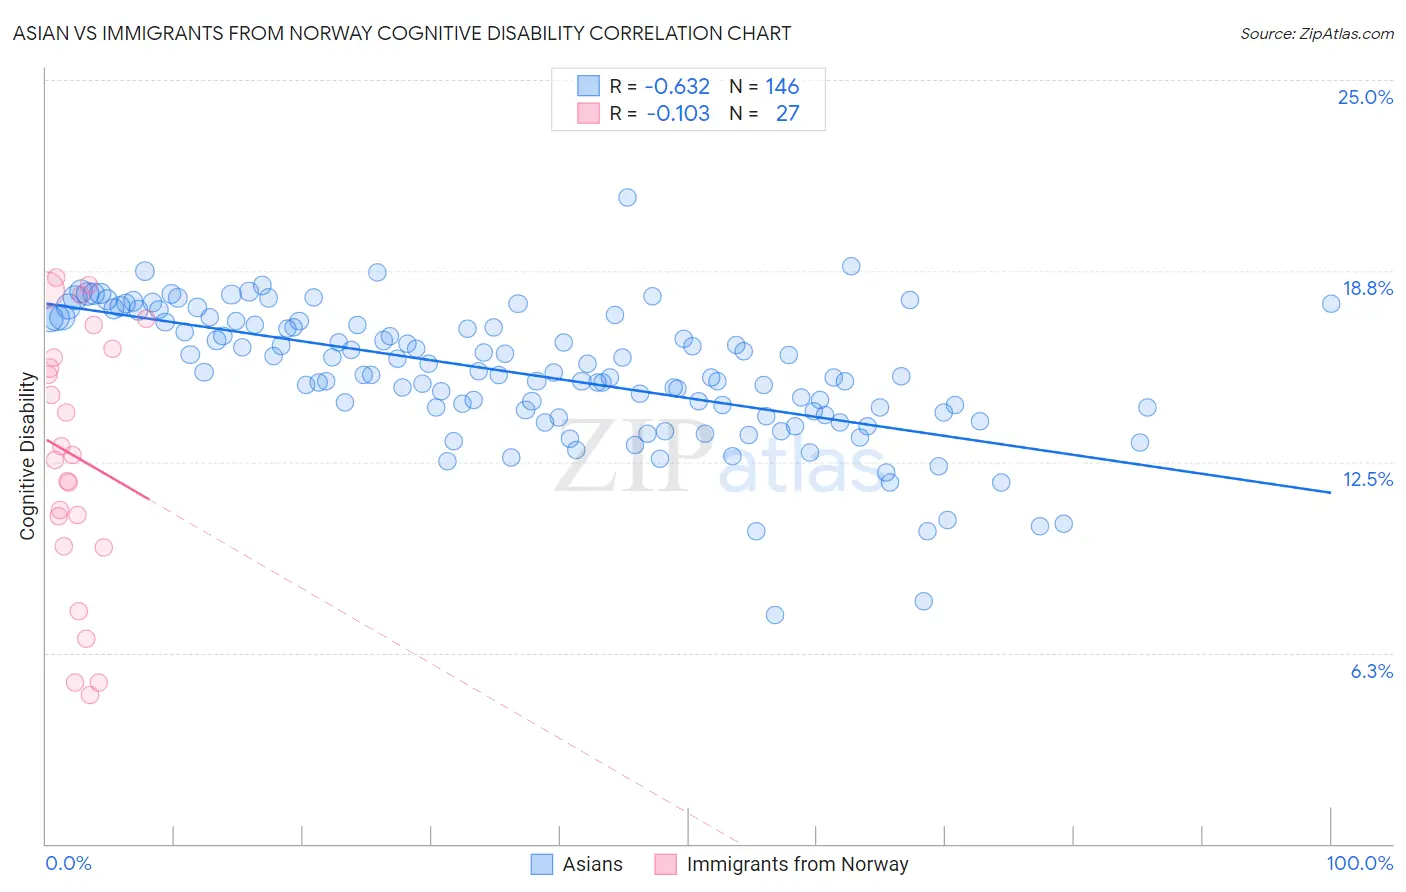
Asian vs Immigrants from Norway Cognitive Disability Correlation Chart
The statistical analysis conducted on geographies consisting of 550,791,869 people shows a significant negative correlation between the proportion of Asians and percentage of population with cognitive disability in the United States with a correlation coefficient (R) of -0.632 and weighted average of 16.7%. Similarly, the statistical analysis conducted on geographies consisting of 116,706,385 people shows a poor negative correlation between the proportion of Immigrants from Norway and percentage of population with cognitive disability in the United States with a correlation coefficient (R) of -0.103 and weighted average of 17.0%, a difference of 1.5%.
Cognitive Disability Correlation Summary
| Measurement | Asian | Immigrants from Norway |
| Minimum | 7.5% | 4.9% |
| Maximum | 21.2% | 18.5% |
| Range | 13.7% | 13.7% |
| Mean | 15.4% | 12.7% |
| Median | 15.4% | 12.7% |
| Interquartile 25% (IQ1) | 14.2% | 9.7% |
| Interquartile 75% (IQ3) | 17.1% | 16.2% |
| Interquartile Range (IQR) | 3.0% | 6.5% |
| Standard Deviation (Sample) | 2.2% | 4.2% |
| Standard Deviation (Population) | 2.2% | 4.2% |
Similar Demographics by Cognitive Disability
Demographics Similar to Asians by Cognitive Disability
In terms of cognitive disability, the demographic groups most similar to Asians are Immigrants from Southern Europe (16.7%, a difference of 0.040%), Immigrants from South America (16.7%, a difference of 0.050%), Danish (16.7%, a difference of 0.060%), English (16.8%, a difference of 0.060%), and Immigrants from Egypt (16.7%, a difference of 0.070%).
| Demographics | Rating | Rank | Cognitive Disability |
| Native Hawaiians | 99.0 /100 | #87 | Exceptional 16.7% |
| Immigrants | Philippines | 99.0 /100 | #88 | Exceptional 16.7% |
| Immigrants | Egypt | 98.8 /100 | #89 | Exceptional 16.7% |
| South Americans | 98.8 /100 | #90 | Exceptional 16.7% |
| Danes | 98.8 /100 | #91 | Exceptional 16.7% |
| Immigrants | South America | 98.8 /100 | #92 | Exceptional 16.7% |
| Immigrants | Southern Europe | 98.7 /100 | #93 | Exceptional 16.7% |
| Asians | 98.7 /100 | #94 | Exceptional 16.7% |
| English | 98.6 /100 | #95 | Exceptional 16.8% |
| Finns | 98.5 /100 | #96 | Exceptional 16.8% |
| Dutch | 98.5 /100 | #97 | Exceptional 16.8% |
| Immigrants | Lebanon | 98.4 /100 | #98 | Exceptional 16.8% |
| Jordanians | 98.2 /100 | #99 | Exceptional 16.8% |
| Immigrants | Russia | 98.2 /100 | #100 | Exceptional 16.8% |
| Immigrants | Asia | 98.1 /100 | #101 | Exceptional 16.8% |
Demographics Similar to Immigrants from Norway by Cognitive Disability
In terms of cognitive disability, the demographic groups most similar to Immigrants from Norway are Israeli (17.0%, a difference of 0.0%), Welsh (17.0%, a difference of 0.020%), Lebanese (17.0%, a difference of 0.030%), Immigrants from Chile (17.0%, a difference of 0.070%), and French (17.0%, a difference of 0.080%).
| Demographics | Rating | Rank | Cognitive Disability |
| Immigrants | Vietnam | 92.4 /100 | #130 | Exceptional 17.0% |
| Immigrants | Germany | 92.1 /100 | #131 | Exceptional 17.0% |
| Whites/Caucasians | 92.1 /100 | #132 | Exceptional 17.0% |
| Immigrants | Jordan | 91.9 /100 | #133 | Exceptional 17.0% |
| Immigrants | Chile | 91.7 /100 | #134 | Exceptional 17.0% |
| Lebanese | 91.3 /100 | #135 | Exceptional 17.0% |
| Israelis | 91.0 /100 | #136 | Exceptional 17.0% |
| Immigrants | Norway | 90.9 /100 | #137 | Exceptional 17.0% |
| Welsh | 90.8 /100 | #138 | Exceptional 17.0% |
| French | 90.0 /100 | #139 | Excellent 17.0% |
| Chileans | 89.9 /100 | #140 | Excellent 17.0% |
| Aleuts | 89.9 /100 | #141 | Excellent 17.0% |
| Carpatho Rusyns | 89.6 /100 | #142 | Excellent 17.0% |
| British | 89.3 /100 | #143 | Excellent 17.0% |
| Immigrants | Brazil | 89.3 /100 | #144 | Excellent 17.0% |