Iroquois vs Yugoslavian Cognitive Disability
COMPARE
Iroquois
Yugoslavian
Cognitive Disability
Cognitive Disability Comparison
Iroquois
Yugoslavians
18.2%
COGNITIVE DISABILITY
0.1/ 100
METRIC RATING
292nd/ 347
METRIC RANK
17.2%
COGNITIVE DISABILITY
71.6/ 100
METRIC RATING
162nd/ 347
METRIC RANK
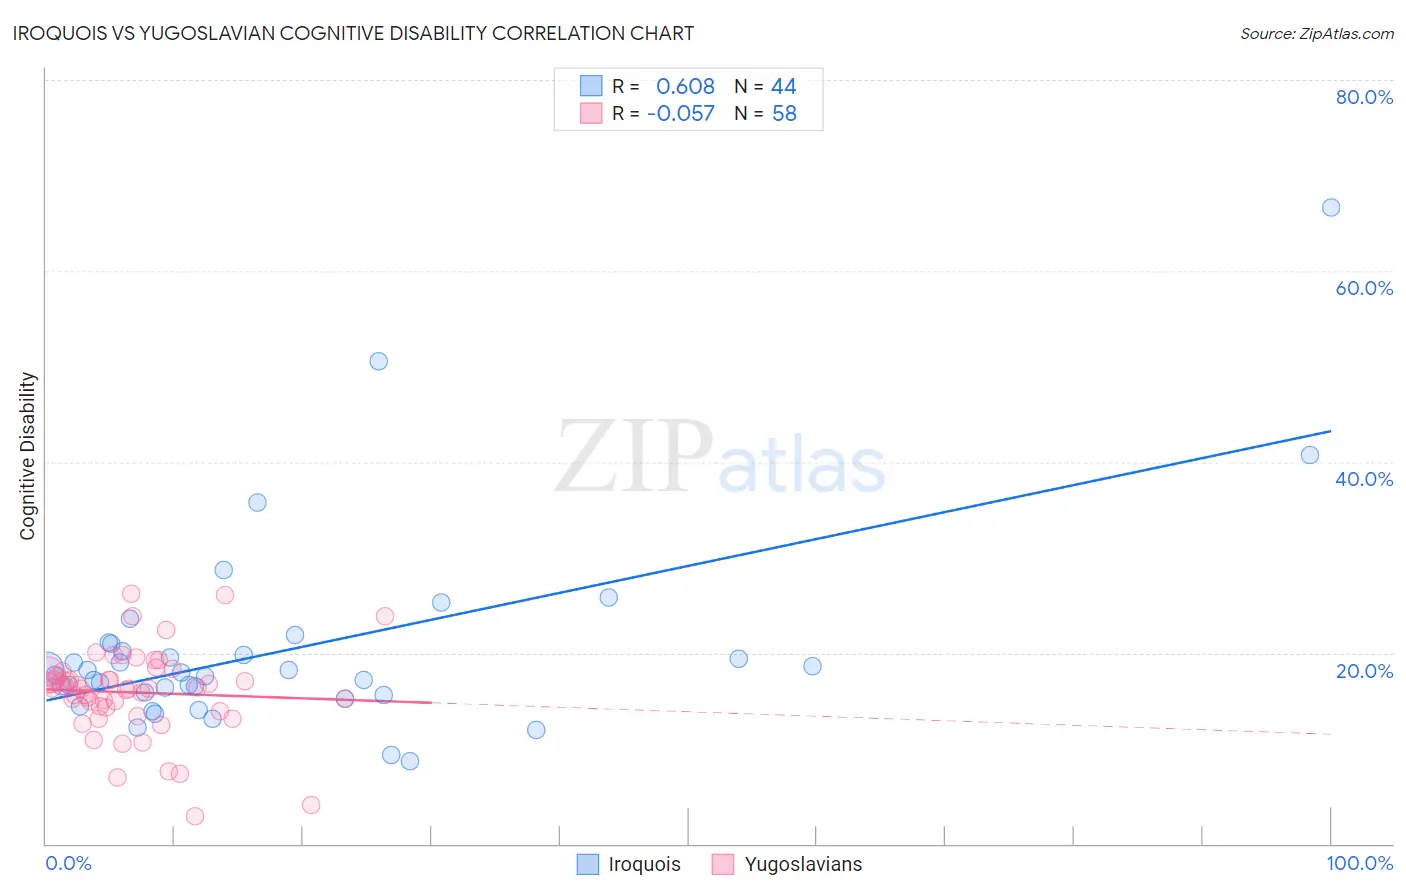
Iroquois vs Yugoslavian Cognitive Disability Correlation Chart
The statistical analysis conducted on geographies consisting of 207,276,810 people shows a significant positive correlation between the proportion of Iroquois and percentage of population with cognitive disability in the United States with a correlation coefficient (R) of 0.608 and weighted average of 18.2%. Similarly, the statistical analysis conducted on geographies consisting of 285,698,583 people shows a slight negative correlation between the proportion of Yugoslavians and percentage of population with cognitive disability in the United States with a correlation coefficient (R) of -0.057 and weighted average of 17.2%, a difference of 5.9%.
Cognitive Disability Correlation Summary
| Measurement | Iroquois | Yugoslavian |
| Minimum | 8.7% | 2.9% |
| Maximum | 66.7% | 26.1% |
| Range | 58.0% | 23.2% |
| Mean | 20.3% | 15.9% |
| Median | 17.8% | 16.3% |
| Interquartile 25% (IQ1) | 15.7% | 14.3% |
| Interquartile 75% (IQ3) | 20.6% | 17.7% |
| Interquartile Range (IQR) | 4.8% | 3.4% |
| Standard Deviation (Sample) | 10.4% | 4.5% |
| Standard Deviation (Population) | 10.3% | 4.5% |
Similar Demographics by Cognitive Disability
Demographics Similar to Iroquois by Cognitive Disability
In terms of cognitive disability, the demographic groups most similar to Iroquois are Central American Indian (18.2%, a difference of 0.010%), Ottawa (18.2%, a difference of 0.070%), British West Indian (18.2%, a difference of 0.080%), Immigrants from Africa (18.1%, a difference of 0.20%), and Native/Alaskan (18.1%, a difference of 0.23%).
| Demographics | Rating | Rank | Cognitive Disability |
| Bermudans | 0.1 /100 | #285 | Tragic 18.1% |
| Kenyans | 0.1 /100 | #286 | Tragic 18.1% |
| Dutch West Indians | 0.1 /100 | #287 | Tragic 18.1% |
| Immigrants | West Indies | 0.1 /100 | #288 | Tragic 18.1% |
| Natives/Alaskans | 0.1 /100 | #289 | Tragic 18.1% |
| Immigrants | Africa | 0.1 /100 | #290 | Tragic 18.1% |
| Ottawa | 0.1 /100 | #291 | Tragic 18.2% |
| Iroquois | 0.1 /100 | #292 | Tragic 18.2% |
| Central American Indians | 0.1 /100 | #293 | Tragic 18.2% |
| British West Indians | 0.1 /100 | #294 | Tragic 18.2% |
| German Russians | 0.0 /100 | #295 | Tragic 18.2% |
| Immigrants | Burma/Myanmar | 0.0 /100 | #296 | Tragic 18.2% |
| Blackfeet | 0.0 /100 | #297 | Tragic 18.3% |
| Japanese | 0.0 /100 | #298 | Tragic 18.3% |
| Ghanaians | 0.0 /100 | #299 | Tragic 18.3% |
Demographics Similar to Yugoslavians by Cognitive Disability
In terms of cognitive disability, the demographic groups most similar to Yugoslavians are Immigrants from Switzerland (17.2%, a difference of 0.0%), American (17.2%, a difference of 0.020%), Australian (17.2%, a difference of 0.030%), Armenian (17.2%, a difference of 0.050%), and Immigrants from Latvia (17.2%, a difference of 0.060%).
| Demographics | Rating | Rank | Cognitive Disability |
| Brazilians | 78.9 /100 | #155 | Good 17.1% |
| Sri Lankans | 78.9 /100 | #156 | Good 17.1% |
| Immigrants | Australia | 76.0 /100 | #157 | Good 17.1% |
| Celtics | 74.1 /100 | #158 | Good 17.1% |
| Immigrants | Latvia | 73.2 /100 | #159 | Good 17.2% |
| Australians | 72.4 /100 | #160 | Good 17.2% |
| Americans | 72.2 /100 | #161 | Good 17.2% |
| Yugoslavians | 71.6 /100 | #162 | Good 17.2% |
| Immigrants | Switzerland | 71.5 /100 | #163 | Good 17.2% |
| Armenians | 70.1 /100 | #164 | Good 17.2% |
| Immigrants | Albania | 64.9 /100 | #165 | Good 17.2% |
| Immigrants | Ecuador | 64.4 /100 | #166 | Good 17.2% |
| Immigrants | Syria | 63.5 /100 | #167 | Good 17.2% |
| Immigrants | Immigrants | 62.5 /100 | #168 | Good 17.2% |
| Immigrants | Portugal | 61.8 /100 | #169 | Good 17.2% |