Iroquois vs Afghan Cognitive Disability
COMPARE
Iroquois
Afghan
Cognitive Disability
Cognitive Disability Comparison
Iroquois
Afghans
18.2%
COGNITIVE DISABILITY
0.1/ 100
METRIC RATING
292nd/ 347
METRIC RANK
17.3%
COGNITIVE DISABILITY
38.2/ 100
METRIC RATING
185th/ 347
METRIC RANK
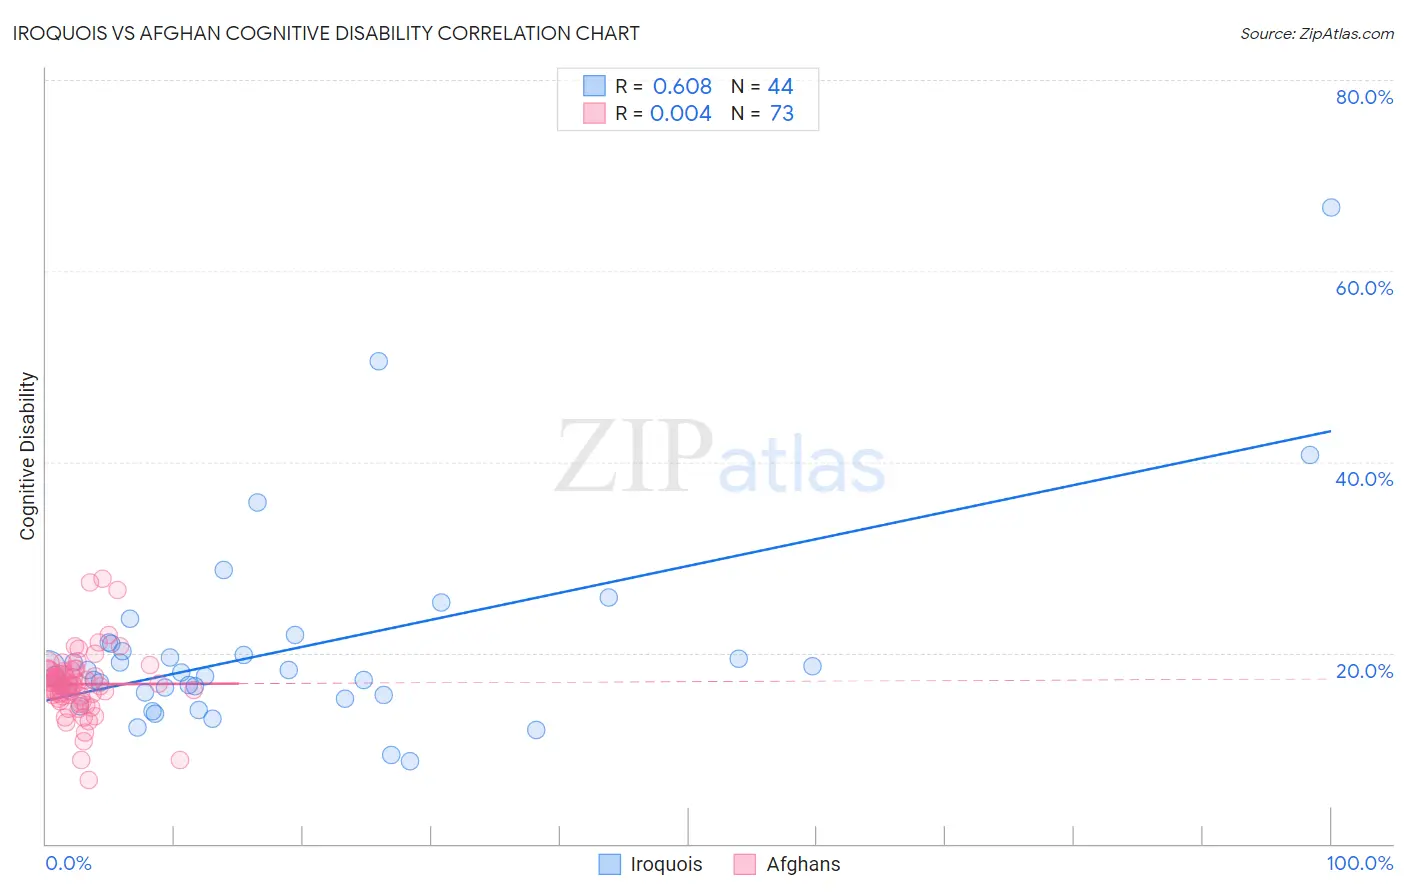
Iroquois vs Afghan Cognitive Disability Correlation Chart
The statistical analysis conducted on geographies consisting of 207,276,810 people shows a significant positive correlation between the proportion of Iroquois and percentage of population with cognitive disability in the United States with a correlation coefficient (R) of 0.608 and weighted average of 18.2%. Similarly, the statistical analysis conducted on geographies consisting of 148,870,382 people shows no correlation between the proportion of Afghans and percentage of population with cognitive disability in the United States with a correlation coefficient (R) of 0.004 and weighted average of 17.3%, a difference of 4.9%.
Cognitive Disability Correlation Summary
| Measurement | Iroquois | Afghan |
| Minimum | 8.7% | 6.7% |
| Maximum | 66.7% | 27.8% |
| Range | 58.0% | 21.0% |
| Mean | 20.3% | 16.7% |
| Median | 17.8% | 16.7% |
| Interquartile 25% (IQ1) | 15.7% | 15.3% |
| Interquartile 75% (IQ3) | 20.6% | 18.2% |
| Interquartile Range (IQR) | 4.8% | 2.9% |
| Standard Deviation (Sample) | 10.4% | 3.5% |
| Standard Deviation (Population) | 10.3% | 3.5% |
Similar Demographics by Cognitive Disability
Demographics Similar to Iroquois by Cognitive Disability
In terms of cognitive disability, the demographic groups most similar to Iroquois are Central American Indian (18.2%, a difference of 0.010%), Ottawa (18.2%, a difference of 0.070%), British West Indian (18.2%, a difference of 0.080%), Immigrants from Africa (18.1%, a difference of 0.20%), and Native/Alaskan (18.1%, a difference of 0.23%).
| Demographics | Rating | Rank | Cognitive Disability |
| Bermudans | 0.1 /100 | #285 | Tragic 18.1% |
| Kenyans | 0.1 /100 | #286 | Tragic 18.1% |
| Dutch West Indians | 0.1 /100 | #287 | Tragic 18.1% |
| Immigrants | West Indies | 0.1 /100 | #288 | Tragic 18.1% |
| Natives/Alaskans | 0.1 /100 | #289 | Tragic 18.1% |
| Immigrants | Africa | 0.1 /100 | #290 | Tragic 18.1% |
| Ottawa | 0.1 /100 | #291 | Tragic 18.2% |
| Iroquois | 0.1 /100 | #292 | Tragic 18.2% |
| Central American Indians | 0.1 /100 | #293 | Tragic 18.2% |
| British West Indians | 0.1 /100 | #294 | Tragic 18.2% |
| German Russians | 0.0 /100 | #295 | Tragic 18.2% |
| Immigrants | Burma/Myanmar | 0.0 /100 | #296 | Tragic 18.2% |
| Blackfeet | 0.0 /100 | #297 | Tragic 18.3% |
| Japanese | 0.0 /100 | #298 | Tragic 18.3% |
| Ghanaians | 0.0 /100 | #299 | Tragic 18.3% |
Demographics Similar to Afghans by Cognitive Disability
In terms of cognitive disability, the demographic groups most similar to Afghans are Crow (17.3%, a difference of 0.030%), Spaniard (17.3%, a difference of 0.060%), Cambodian (17.3%, a difference of 0.070%), Immigrants from Guyana (17.3%, a difference of 0.14%), and Arab (17.3%, a difference of 0.14%).
| Demographics | Rating | Rank | Cognitive Disability |
| Spanish | 48.9 /100 | #178 | Average 17.3% |
| Sioux | 48.6 /100 | #179 | Average 17.3% |
| Pakistanis | 43.9 /100 | #180 | Average 17.3% |
| Immigrants | Guyana | 42.9 /100 | #181 | Average 17.3% |
| Arabs | 42.8 /100 | #182 | Average 17.3% |
| Spaniards | 40.3 /100 | #183 | Average 17.3% |
| Crow | 39.1 /100 | #184 | Fair 17.3% |
| Afghans | 38.2 /100 | #185 | Fair 17.3% |
| Cambodians | 35.9 /100 | #186 | Fair 17.3% |
| Immigrants | Fiji | 33.7 /100 | #187 | Fair 17.4% |
| Immigrants | France | 29.8 /100 | #188 | Fair 17.4% |
| Immigrants | Western Asia | 29.5 /100 | #189 | Fair 17.4% |
| Immigrants | Spain | 27.7 /100 | #190 | Fair 17.4% |
| Immigrants | Nonimmigrants | 27.4 /100 | #191 | Fair 17.4% |
| Immigrants | Haiti | 27.1 /100 | #192 | Fair 17.4% |