Iroquois vs Cherokee Cognitive Disability
COMPARE
Iroquois
Cherokee
Cognitive Disability
Cognitive Disability Comparison
Iroquois
Cherokee
18.2%
COGNITIVE DISABILITY
0.1/ 100
METRIC RATING
292nd/ 347
METRIC RANK
18.0%
COGNITIVE DISABILITY
0.3/ 100
METRIC RATING
268th/ 347
METRIC RANK
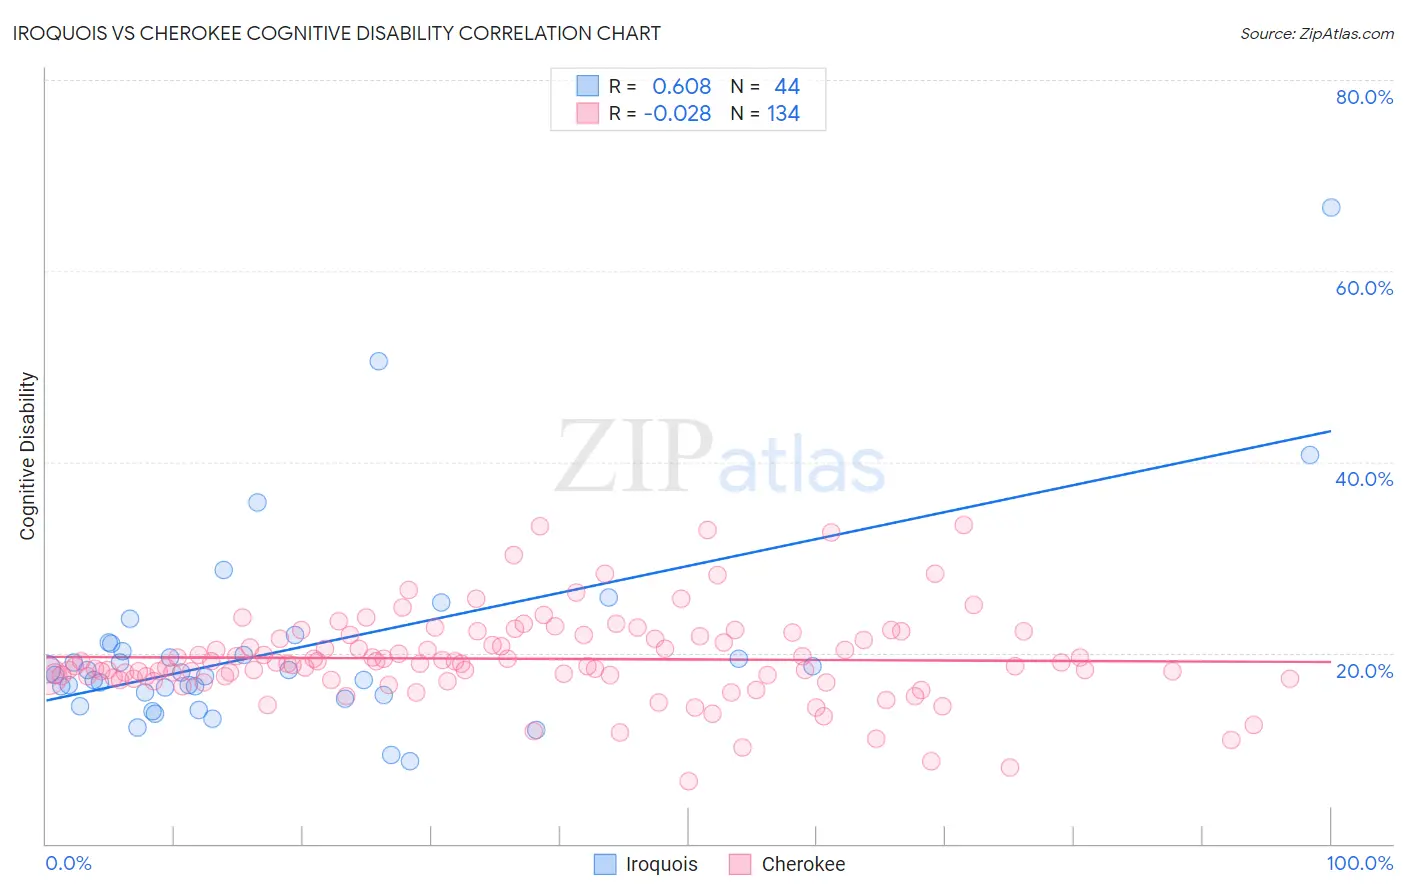
Iroquois vs Cherokee Cognitive Disability Correlation Chart
The statistical analysis conducted on geographies consisting of 207,276,810 people shows a significant positive correlation between the proportion of Iroquois and percentage of population with cognitive disability in the United States with a correlation coefficient (R) of 0.608 and weighted average of 18.2%. Similarly, the statistical analysis conducted on geographies consisting of 493,579,775 people shows no correlation between the proportion of Cherokee and percentage of population with cognitive disability in the United States with a correlation coefficient (R) of -0.028 and weighted average of 18.0%, a difference of 1.1%.
Cognitive Disability Correlation Summary
| Measurement | Iroquois | Cherokee |
| Minimum | 8.7% | 6.5% |
| Maximum | 66.7% | 33.3% |
| Range | 58.0% | 26.8% |
| Mean | 20.3% | 19.4% |
| Median | 17.8% | 18.9% |
| Interquartile 25% (IQ1) | 15.7% | 17.4% |
| Interquartile 75% (IQ3) | 20.6% | 21.8% |
| Interquartile Range (IQR) | 4.8% | 4.4% |
| Standard Deviation (Sample) | 10.4% | 4.6% |
| Standard Deviation (Population) | 10.3% | 4.6% |
Similar Demographics by Cognitive Disability
Demographics Similar to Iroquois by Cognitive Disability
In terms of cognitive disability, the demographic groups most similar to Iroquois are Central American Indian (18.2%, a difference of 0.010%), Ottawa (18.2%, a difference of 0.070%), British West Indian (18.2%, a difference of 0.080%), Immigrants from Africa (18.1%, a difference of 0.20%), and Native/Alaskan (18.1%, a difference of 0.23%).
| Demographics | Rating | Rank | Cognitive Disability |
| Bermudans | 0.1 /100 | #285 | Tragic 18.1% |
| Kenyans | 0.1 /100 | #286 | Tragic 18.1% |
| Dutch West Indians | 0.1 /100 | #287 | Tragic 18.1% |
| Immigrants | West Indies | 0.1 /100 | #288 | Tragic 18.1% |
| Natives/Alaskans | 0.1 /100 | #289 | Tragic 18.1% |
| Immigrants | Africa | 0.1 /100 | #290 | Tragic 18.1% |
| Ottawa | 0.1 /100 | #291 | Tragic 18.2% |
| Iroquois | 0.1 /100 | #292 | Tragic 18.2% |
| Central American Indians | 0.1 /100 | #293 | Tragic 18.2% |
| British West Indians | 0.1 /100 | #294 | Tragic 18.2% |
| German Russians | 0.0 /100 | #295 | Tragic 18.2% |
| Immigrants | Burma/Myanmar | 0.0 /100 | #296 | Tragic 18.2% |
| Blackfeet | 0.0 /100 | #297 | Tragic 18.3% |
| Japanese | 0.0 /100 | #298 | Tragic 18.3% |
| Ghanaians | 0.0 /100 | #299 | Tragic 18.3% |
Demographics Similar to Cherokee by Cognitive Disability
In terms of cognitive disability, the demographic groups most similar to Cherokee are Nepalese (18.0%, a difference of 0.010%), Spanish American (18.0%, a difference of 0.070%), Belizean (18.0%, a difference of 0.070%), Menominee (18.0%, a difference of 0.10%), and Honduran (18.0%, a difference of 0.14%).
| Demographics | Rating | Rank | Cognitive Disability |
| Guamanians/Chamorros | 0.5 /100 | #261 | Tragic 17.9% |
| Sierra Leoneans | 0.4 /100 | #262 | Tragic 17.9% |
| Immigrants | Barbados | 0.4 /100 | #263 | Tragic 17.9% |
| Menominee | 0.4 /100 | #264 | Tragic 18.0% |
| Spanish Americans | 0.4 /100 | #265 | Tragic 18.0% |
| Belizeans | 0.4 /100 | #266 | Tragic 18.0% |
| Nepalese | 0.3 /100 | #267 | Tragic 18.0% |
| Cherokee | 0.3 /100 | #268 | Tragic 18.0% |
| Hondurans | 0.3 /100 | #269 | Tragic 18.0% |
| Immigrants | Bahamas | 0.3 /100 | #270 | Tragic 18.0% |
| Potawatomi | 0.2 /100 | #271 | Tragic 18.0% |
| Immigrants | Honduras | 0.2 /100 | #272 | Tragic 18.0% |
| Immigrants | Nepal | 0.2 /100 | #273 | Tragic 18.0% |
| Immigrants | Nigeria | 0.2 /100 | #274 | Tragic 18.0% |
| Immigrants | Laos | 0.2 /100 | #275 | Tragic 18.1% |