Irish vs Immigrants from Liberia Female Disability
COMPARE
Irish
Immigrants from Liberia
Female Disability
Female Disability Comparison
Irish
Immigrants from Liberia
13.1%
FEMALE DISABILITY
0.1/ 100
METRIC RATING
280th/ 347
METRIC RANK
12.9%
FEMALE DISABILITY
0.3/ 100
METRIC RATING
270th/ 347
METRIC RANK
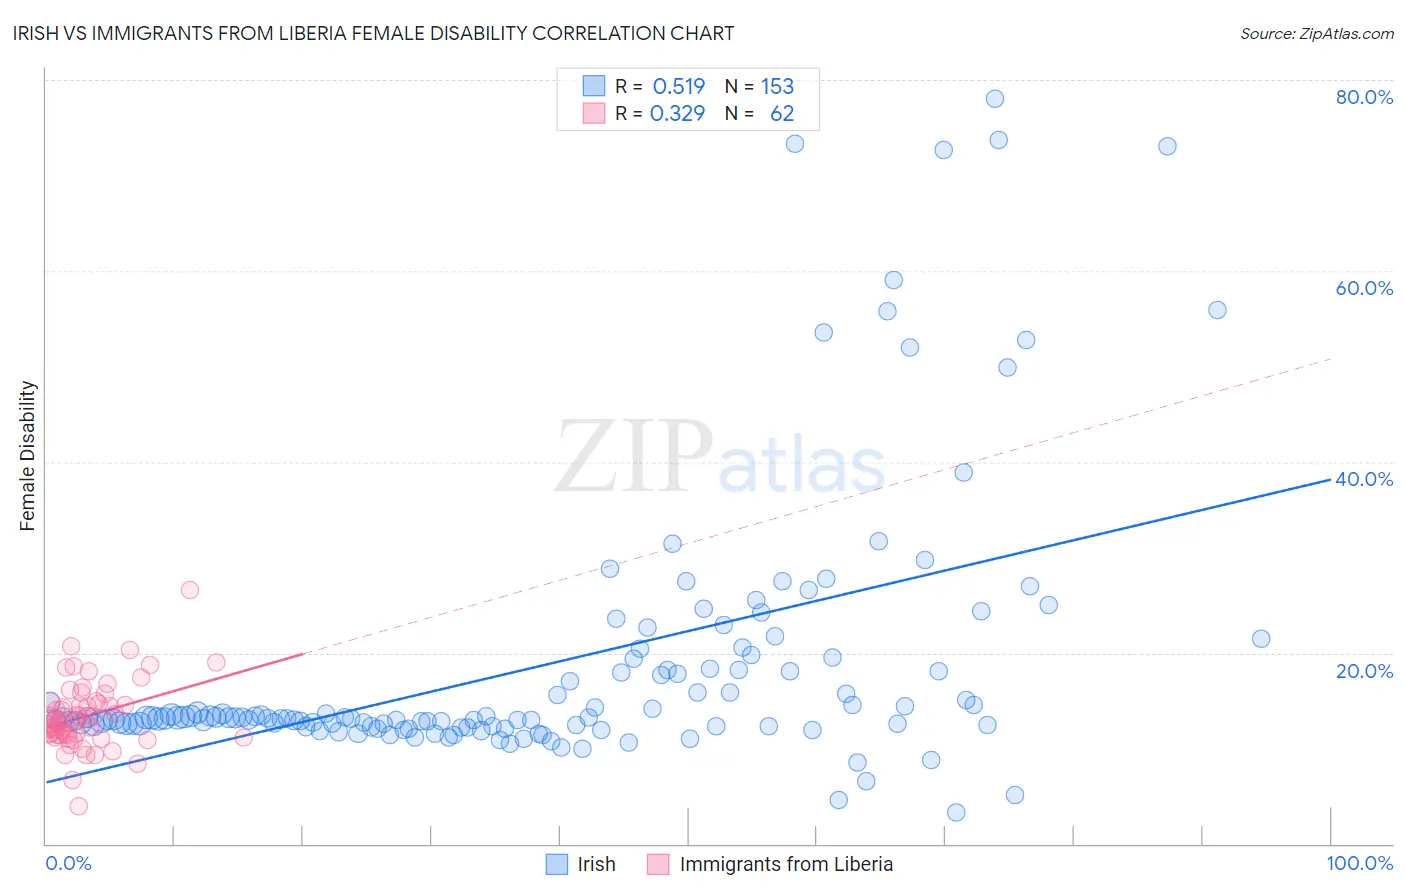
Irish vs Immigrants from Liberia Female Disability Correlation Chart
The statistical analysis conducted on geographies consisting of 580,159,528 people shows a substantial positive correlation between the proportion of Irish and percentage of females with a disability in the United States with a correlation coefficient (R) of 0.519 and weighted average of 13.1%. Similarly, the statistical analysis conducted on geographies consisting of 135,259,122 people shows a mild positive correlation between the proportion of Immigrants from Liberia and percentage of females with a disability in the United States with a correlation coefficient (R) of 0.329 and weighted average of 12.9%, a difference of 1.6%.
Female Disability Correlation Summary
| Measurement | Irish | Immigrants from Liberia |
| Minimum | 3.2% | 3.9% |
| Maximum | 78.1% | 26.5% |
| Range | 74.9% | 22.6% |
| Mean | 18.7% | 13.4% |
| Median | 13.2% | 12.9% |
| Interquartile 25% (IQ1) | 12.4% | 11.4% |
| Interquartile 75% (IQ3) | 18.3% | 14.9% |
| Interquartile Range (IQR) | 5.9% | 3.5% |
| Standard Deviation (Sample) | 14.2% | 3.6% |
| Standard Deviation (Population) | 14.1% | 3.6% |
Demographics Similar to Irish and Immigrants from Liberia by Female Disability
In terms of female disability, the demographic groups most similar to Irish are U.S. Virgin Islander (13.1%, a difference of 0.030%), Arapaho (13.0%, a difference of 0.090%), Welsh (13.1%, a difference of 0.11%), English (13.1%, a difference of 0.12%), and Hmong (13.1%, a difference of 0.25%). Similarly, the demographic groups most similar to Immigrants from Liberia are Indonesian (12.8%, a difference of 0.18%), Immigrants from Laos (12.8%, a difference of 0.24%), Senegalese (12.8%, a difference of 0.27%), Finnish (12.8%, a difference of 0.28%), and West Indian (12.8%, a difference of 0.40%).
| Demographics | Rating | Rank | Female Disability |
| West Indians | 0.5 /100 | #265 | Tragic 12.8% |
| Finns | 0.4 /100 | #266 | Tragic 12.8% |
| Senegalese | 0.4 /100 | #267 | Tragic 12.8% |
| Immigrants | Laos | 0.4 /100 | #268 | Tragic 12.8% |
| Indonesians | 0.4 /100 | #269 | Tragic 12.8% |
| Immigrants | Liberia | 0.3 /100 | #270 | Tragic 12.9% |
| Dutch | 0.2 /100 | #271 | Tragic 12.9% |
| Germans | 0.1 /100 | #272 | Tragic 12.9% |
| Sioux | 0.1 /100 | #273 | Tragic 12.9% |
| Portuguese | 0.1 /100 | #274 | Tragic 13.0% |
| Cheyenne | 0.1 /100 | #275 | Tragic 13.0% |
| Immigrants | Dominica | 0.1 /100 | #276 | Tragic 13.0% |
| Spanish | 0.1 /100 | #277 | Tragic 13.0% |
| Scottish | 0.1 /100 | #278 | Tragic 13.0% |
| Arapaho | 0.1 /100 | #279 | Tragic 13.0% |
| Irish | 0.1 /100 | #280 | Tragic 13.1% |
| U.S. Virgin Islanders | 0.1 /100 | #281 | Tragic 13.1% |
| Welsh | 0.0 /100 | #282 | Tragic 13.1% |
| English | 0.0 /100 | #283 | Tragic 13.1% |
| Hmong | 0.0 /100 | #284 | Tragic 13.1% |
| Bangladeshis | 0.0 /100 | #285 | Tragic 13.1% |