Irish vs Immigrants from Liberia Unemployment Among Women with Children Ages 6 to 17 years
COMPARE
Irish
Immigrants from Liberia
Unemployment Among Women with Children Ages 6 to 17 years
Unemployment Among Women with Children Ages 6 to 17 years Comparison
Irish
Immigrants from Liberia
9.5%
UNEMPLOYMENT AMONG WOMEN WITH CHILDREN AGES 6 TO 17 YEARS
0.3/ 100
METRIC RATING
267th/ 347
METRIC RANK
10.3%
UNEMPLOYMENT AMONG WOMEN WITH CHILDREN AGES 6 TO 17 YEARS
0.0/ 100
METRIC RATING
311th/ 347
METRIC RANK
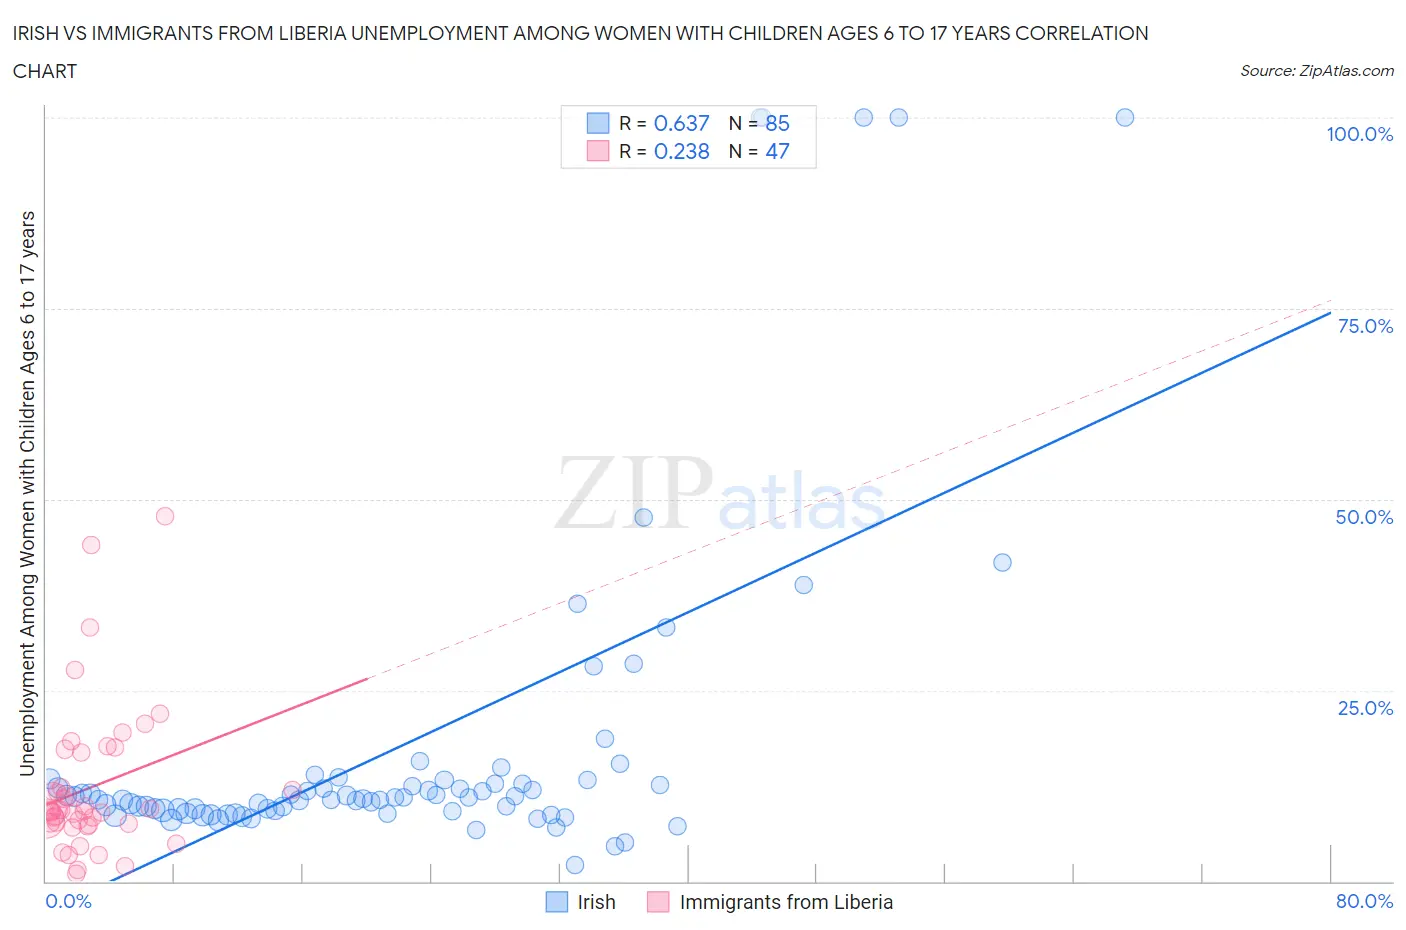
Irish vs Immigrants from Liberia Unemployment Among Women with Children Ages 6 to 17 years Correlation Chart
The statistical analysis conducted on geographies consisting of 359,522,437 people shows a significant positive correlation between the proportion of Irish and unemployment rate among women with children between the ages 6 and 17 in the United States with a correlation coefficient (R) of 0.637 and weighted average of 9.5%. Similarly, the statistical analysis conducted on geographies consisting of 118,003,390 people shows a weak positive correlation between the proportion of Immigrants from Liberia and unemployment rate among women with children between the ages 6 and 17 in the United States with a correlation coefficient (R) of 0.238 and weighted average of 10.3%, a difference of 8.1%.
Unemployment Among Women with Children Ages 6 to 17 years Correlation Summary
| Measurement | Irish | Immigrants from Liberia |
| Minimum | 2.1% | 1.0% |
| Maximum | 100.0% | 47.9% |
| Range | 97.9% | 46.9% |
| Mean | 17.8% | 12.2% |
| Median | 10.9% | 9.2% |
| Interquartile 25% (IQ1) | 9.2% | 7.5% |
| Interquartile 75% (IQ3) | 13.0% | 16.9% |
| Interquartile Range (IQR) | 3.8% | 9.4% |
| Standard Deviation (Sample) | 22.1% | 9.7% |
| Standard Deviation (Population) | 21.9% | 9.6% |
Similar Demographics by Unemployment Among Women with Children Ages 6 to 17 years
Demographics Similar to Irish by Unemployment Among Women with Children Ages 6 to 17 years
In terms of unemployment among women with children ages 6 to 17 years, the demographic groups most similar to Irish are Immigrants from Jamaica (9.5%, a difference of 0.020%), West Indian (9.5%, a difference of 0.18%), Immigrants from Ghana (9.5%, a difference of 0.21%), Ghanaian (9.6%, a difference of 0.39%), and Lebanese (9.5%, a difference of 0.45%).
| Demographics | Rating | Rank | Unemployment Among Women with Children Ages 6 to 17 years |
| Italians | 0.6 /100 | #260 | Tragic 9.5% |
| South Americans | 0.5 /100 | #261 | Tragic 9.5% |
| Senegalese | 0.5 /100 | #262 | Tragic 9.5% |
| Lebanese | 0.5 /100 | #263 | Tragic 9.5% |
| Immigrants | Ghana | 0.4 /100 | #264 | Tragic 9.5% |
| West Indians | 0.4 /100 | #265 | Tragic 9.5% |
| Immigrants | Jamaica | 0.3 /100 | #266 | Tragic 9.5% |
| Irish | 0.3 /100 | #267 | Tragic 9.5% |
| Ghanaians | 0.2 /100 | #268 | Tragic 9.6% |
| Blackfeet | 0.2 /100 | #269 | Tragic 9.6% |
| Immigrants | Nicaragua | 0.2 /100 | #270 | Tragic 9.6% |
| Immigrants | Latin America | 0.1 /100 | #271 | Tragic 9.6% |
| Kiowa | 0.1 /100 | #272 | Tragic 9.6% |
| Whites/Caucasians | 0.1 /100 | #273 | Tragic 9.6% |
| Aleuts | 0.1 /100 | #274 | Tragic 9.6% |
Demographics Similar to Immigrants from Liberia by Unemployment Among Women with Children Ages 6 to 17 years
In terms of unemployment among women with children ages 6 to 17 years, the demographic groups most similar to Immigrants from Liberia are Alaska Native (10.3%, a difference of 0.030%), French Canadian (10.3%, a difference of 0.080%), Dutch West Indian (10.2%, a difference of 0.62%), Immigrants from Senegal (10.2%, a difference of 0.63%), and African (10.4%, a difference of 0.84%).
| Demographics | Rating | Rank | Unemployment Among Women with Children Ages 6 to 17 years |
| Immigrants | Venezuela | 0.0 /100 | #304 | Tragic 10.2% |
| Immigrants | Nigeria | 0.0 /100 | #305 | Tragic 10.2% |
| Paraguayans | 0.0 /100 | #306 | Tragic 10.2% |
| Immigrants | Senegal | 0.0 /100 | #307 | Tragic 10.2% |
| Dutch West Indians | 0.0 /100 | #308 | Tragic 10.2% |
| French Canadians | 0.0 /100 | #309 | Tragic 10.3% |
| Alaska Natives | 0.0 /100 | #310 | Tragic 10.3% |
| Immigrants | Liberia | 0.0 /100 | #311 | Tragic 10.3% |
| Africans | 0.0 /100 | #312 | Tragic 10.4% |
| Americans | 0.0 /100 | #313 | Tragic 10.4% |
| Immigrants | Cabo Verde | 0.0 /100 | #314 | Tragic 10.4% |
| Bahamians | 0.0 /100 | #315 | Tragic 10.4% |
| Immigrants | Dominica | 0.0 /100 | #316 | Tragic 10.5% |
| Bermudans | 0.0 /100 | #317 | Tragic 10.5% |
| Delaware | 0.0 /100 | #318 | Tragic 10.5% |