Chippewa vs Immigrants from Liberia Male Disability
COMPARE
Chippewa
Immigrants from Liberia
Male Disability
Male Disability Comparison
Chippewa
Immigrants from Liberia
14.3%
MALE DISABILITY
0.0/ 100
METRIC RATING
328th/ 347
METRIC RANK
11.9%
MALE DISABILITY
1.0/ 100
METRIC RATING
245th/ 347
METRIC RANK
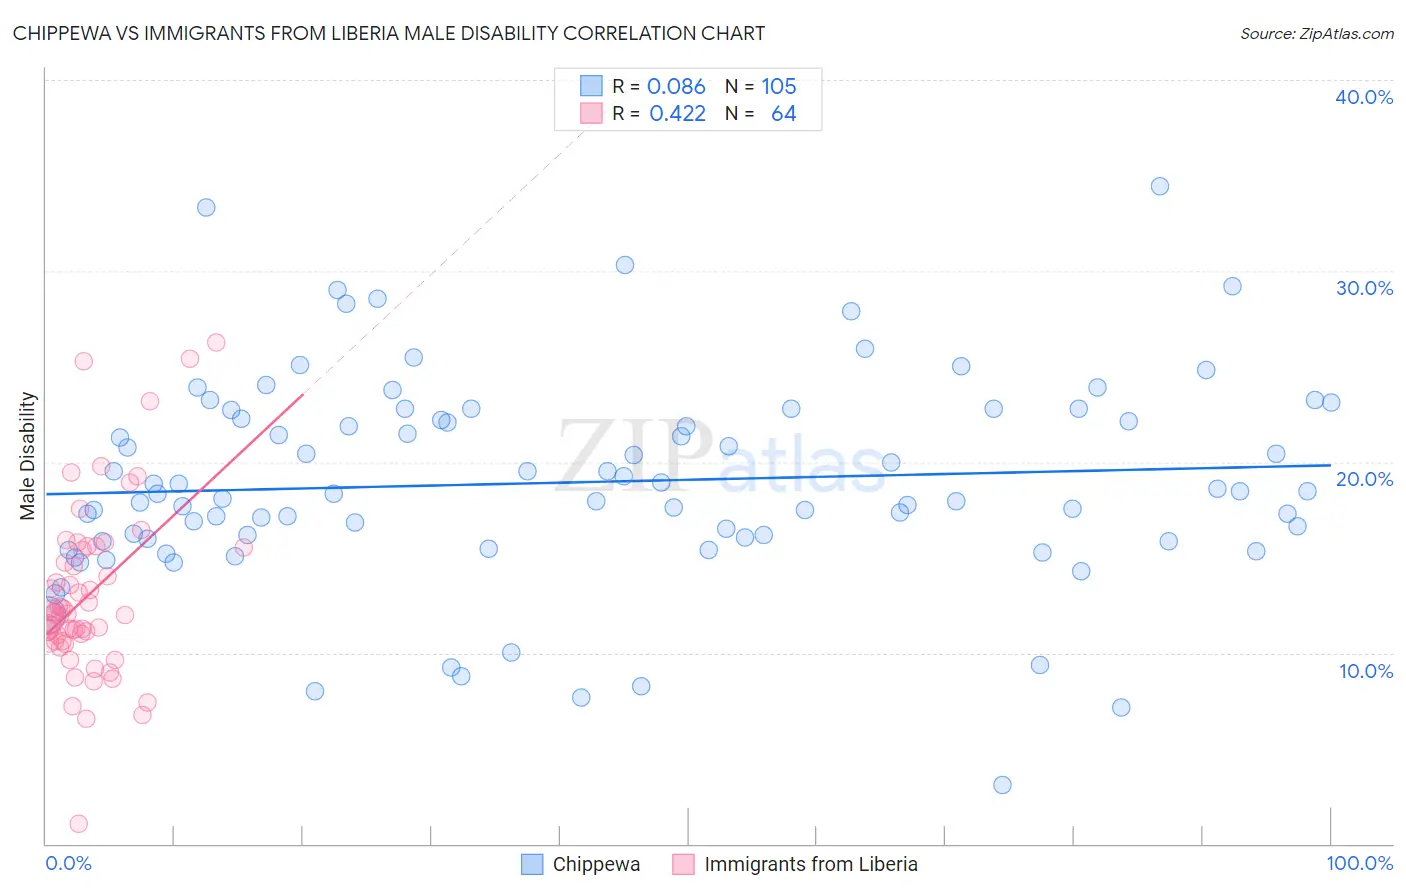
Chippewa vs Immigrants from Liberia Male Disability Correlation Chart
The statistical analysis conducted on geographies consisting of 215,038,110 people shows a slight positive correlation between the proportion of Chippewa and percentage of males with a disability in the United States with a correlation coefficient (R) of 0.086 and weighted average of 14.3%. Similarly, the statistical analysis conducted on geographies consisting of 135,258,288 people shows a moderate positive correlation between the proportion of Immigrants from Liberia and percentage of males with a disability in the United States with a correlation coefficient (R) of 0.422 and weighted average of 11.9%, a difference of 19.7%.
Male Disability Correlation Summary
| Measurement | Chippewa | Immigrants from Liberia |
| Minimum | 3.1% | 1.1% |
| Maximum | 34.5% | 26.3% |
| Range | 31.4% | 25.2% |
| Mean | 18.9% | 13.0% |
| Median | 18.3% | 12.1% |
| Interquartile 25% (IQ1) | 15.9% | 10.6% |
| Interquartile 75% (IQ3) | 22.5% | 15.5% |
| Interquartile Range (IQR) | 6.6% | 4.9% |
| Standard Deviation (Sample) | 5.5% | 4.6% |
| Standard Deviation (Population) | 5.4% | 4.5% |
Similar Demographics by Male Disability
Demographics Similar to Chippewa by Male Disability
In terms of male disability, the demographic groups most similar to Chippewa are Potawatomi (14.2%, a difference of 0.43%), Native/Alaskan (14.2%, a difference of 0.53%), Cajun (14.4%, a difference of 0.57%), Navajo (14.4%, a difference of 0.81%), and Ottawa (14.1%, a difference of 1.5%).
| Demographics | Rating | Rank | Male Disability |
| Shoshone | 0.0 /100 | #321 | Tragic 13.8% |
| Apache | 0.0 /100 | #322 | Tragic 14.0% |
| Osage | 0.0 /100 | #323 | Tragic 14.0% |
| Comanche | 0.0 /100 | #324 | Tragic 14.1% |
| Ottawa | 0.0 /100 | #325 | Tragic 14.1% |
| Natives/Alaskans | 0.0 /100 | #326 | Tragic 14.2% |
| Potawatomi | 0.0 /100 | #327 | Tragic 14.2% |
| Chippewa | 0.0 /100 | #328 | Tragic 14.3% |
| Cajuns | 0.0 /100 | #329 | Tragic 14.4% |
| Navajo | 0.0 /100 | #330 | Tragic 14.4% |
| Tohono O'odham | 0.0 /100 | #331 | Tragic 14.6% |
| Seminole | 0.0 /100 | #332 | Tragic 14.7% |
| Yuman | 0.0 /100 | #333 | Tragic 14.7% |
| Cherokee | 0.0 /100 | #334 | Tragic 14.8% |
| Dutch West Indians | 0.0 /100 | #335 | Tragic 14.8% |
Demographics Similar to Immigrants from Liberia by Male Disability
In terms of male disability, the demographic groups most similar to Immigrants from Liberia are Immigrants from Laos (11.9%, a difference of 0.0%), Danish (11.9%, a difference of 0.030%), Samoan (11.9%, a difference of 0.12%), Northern European (11.9%, a difference of 0.15%), and Bahamian (11.9%, a difference of 0.16%).
| Demographics | Rating | Rank | Male Disability |
| Yugoslavians | 1.2 /100 | #238 | Tragic 11.9% |
| Italians | 1.2 /100 | #239 | Tragic 11.9% |
| Czechs | 1.1 /100 | #240 | Tragic 11.9% |
| Bahamians | 1.1 /100 | #241 | Tragic 11.9% |
| Northern Europeans | 1.1 /100 | #242 | Tragic 11.9% |
| Samoans | 1.1 /100 | #243 | Tragic 11.9% |
| Immigrants | Laos | 1.0 /100 | #244 | Tragic 11.9% |
| Immigrants | Liberia | 1.0 /100 | #245 | Tragic 11.9% |
| Danes | 0.9 /100 | #246 | Tragic 11.9% |
| Hungarians | 0.8 /100 | #247 | Tragic 12.0% |
| Poles | 0.7 /100 | #248 | Tragic 12.0% |
| Immigrants | Yemen | 0.5 /100 | #249 | Tragic 12.0% |
| Bangladeshis | 0.5 /100 | #250 | Tragic 12.0% |
| German Russians | 0.5 /100 | #251 | Tragic 12.0% |
| Slovenes | 0.5 /100 | #252 | Tragic 12.0% |