Cheyenne vs Immigrants from Liberia Male Disability
COMPARE
Cheyenne
Immigrants from Liberia
Male Disability
Male Disability Comparison
Cheyenne
Immigrants from Liberia
13.0%
MALE DISABILITY
0.0/ 100
METRIC RATING
300th/ 347
METRIC RANK
11.9%
MALE DISABILITY
1.0/ 100
METRIC RATING
245th/ 347
METRIC RANK
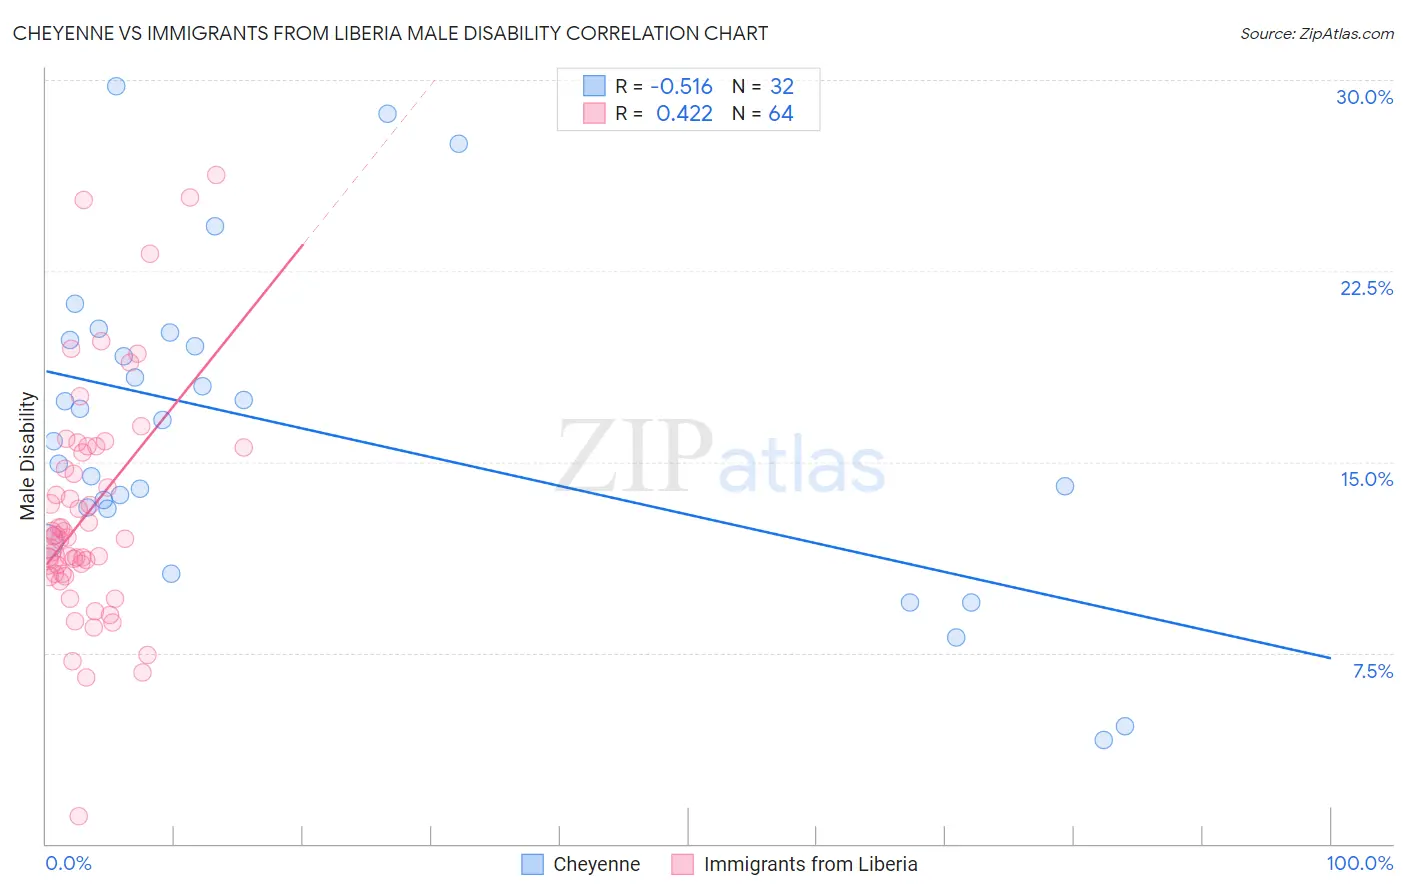
Cheyenne vs Immigrants from Liberia Male Disability Correlation Chart
The statistical analysis conducted on geographies consisting of 80,709,657 people shows a substantial negative correlation between the proportion of Cheyenne and percentage of males with a disability in the United States with a correlation coefficient (R) of -0.516 and weighted average of 13.0%. Similarly, the statistical analysis conducted on geographies consisting of 135,258,288 people shows a moderate positive correlation between the proportion of Immigrants from Liberia and percentage of males with a disability in the United States with a correlation coefficient (R) of 0.422 and weighted average of 11.9%, a difference of 9.2%.
Male Disability Correlation Summary
| Measurement | Cheyenne | Immigrants from Liberia |
| Minimum | 4.1% | 1.1% |
| Maximum | 29.8% | 26.3% |
| Range | 25.7% | 25.2% |
| Mean | 16.3% | 13.0% |
| Median | 16.2% | 12.1% |
| Interquartile 25% (IQ1) | 13.2% | 10.6% |
| Interquartile 75% (IQ3) | 19.7% | 15.5% |
| Interquartile Range (IQR) | 6.5% | 4.9% |
| Standard Deviation (Sample) | 6.1% | 4.6% |
| Standard Deviation (Population) | 6.0% | 4.5% |
Similar Demographics by Male Disability
Demographics Similar to Cheyenne by Male Disability
In terms of male disability, the demographic groups most similar to Cheyenne are French (13.0%, a difference of 0.040%), Celtic (13.0%, a difference of 0.090%), Pennsylvania German (13.0%, a difference of 0.44%), Crow (13.1%, a difference of 0.63%), and Inupiat (13.0%, a difference of 0.64%).
| Demographics | Rating | Rank | Male Disability |
| Yaqui | 0.0 /100 | #293 | Tragic 12.9% |
| Marshallese | 0.0 /100 | #294 | Tragic 12.9% |
| Immigrants | Micronesia | 0.0 /100 | #295 | Tragic 12.9% |
| Immigrants | Nonimmigrants | 0.0 /100 | #296 | Tragic 12.9% |
| Inupiat | 0.0 /100 | #297 | Tragic 13.0% |
| Pennsylvania Germans | 0.0 /100 | #298 | Tragic 13.0% |
| Celtics | 0.0 /100 | #299 | Tragic 13.0% |
| Cheyenne | 0.0 /100 | #300 | Tragic 13.0% |
| French | 0.0 /100 | #301 | Tragic 13.0% |
| Crow | 0.0 /100 | #302 | Tragic 13.1% |
| Scotch-Irish | 0.0 /100 | #303 | Tragic 13.2% |
| Blacks/African Americans | 0.0 /100 | #304 | Tragic 13.2% |
| French Canadians | 0.0 /100 | #305 | Tragic 13.3% |
| Spanish Americans | 0.0 /100 | #306 | Tragic 13.3% |
| Arapaho | 0.0 /100 | #307 | Tragic 13.3% |
Demographics Similar to Immigrants from Liberia by Male Disability
In terms of male disability, the demographic groups most similar to Immigrants from Liberia are Immigrants from Laos (11.9%, a difference of 0.0%), Danish (11.9%, a difference of 0.030%), Samoan (11.9%, a difference of 0.12%), Northern European (11.9%, a difference of 0.15%), and Bahamian (11.9%, a difference of 0.16%).
| Demographics | Rating | Rank | Male Disability |
| Yugoslavians | 1.2 /100 | #238 | Tragic 11.9% |
| Italians | 1.2 /100 | #239 | Tragic 11.9% |
| Czechs | 1.1 /100 | #240 | Tragic 11.9% |
| Bahamians | 1.1 /100 | #241 | Tragic 11.9% |
| Northern Europeans | 1.1 /100 | #242 | Tragic 11.9% |
| Samoans | 1.1 /100 | #243 | Tragic 11.9% |
| Immigrants | Laos | 1.0 /100 | #244 | Tragic 11.9% |
| Immigrants | Liberia | 1.0 /100 | #245 | Tragic 11.9% |
| Danes | 0.9 /100 | #246 | Tragic 11.9% |
| Hungarians | 0.8 /100 | #247 | Tragic 12.0% |
| Poles | 0.7 /100 | #248 | Tragic 12.0% |
| Immigrants | Yemen | 0.5 /100 | #249 | Tragic 12.0% |
| Bangladeshis | 0.5 /100 | #250 | Tragic 12.0% |
| German Russians | 0.5 /100 | #251 | Tragic 12.0% |
| Slovenes | 0.5 /100 | #252 | Tragic 12.0% |