Iraqi vs Sierra Leonean Male Disability
COMPARE
Iraqi
Sierra Leonean
Male Disability
Male Disability Comparison
Iraqis
Sierra Leoneans
11.3%
MALE DISABILITY
30.5/ 100
METRIC RATING
184th/ 347
METRIC RANK
10.5%
MALE DISABILITY
98.7/ 100
METRIC RATING
75th/ 347
METRIC RANK
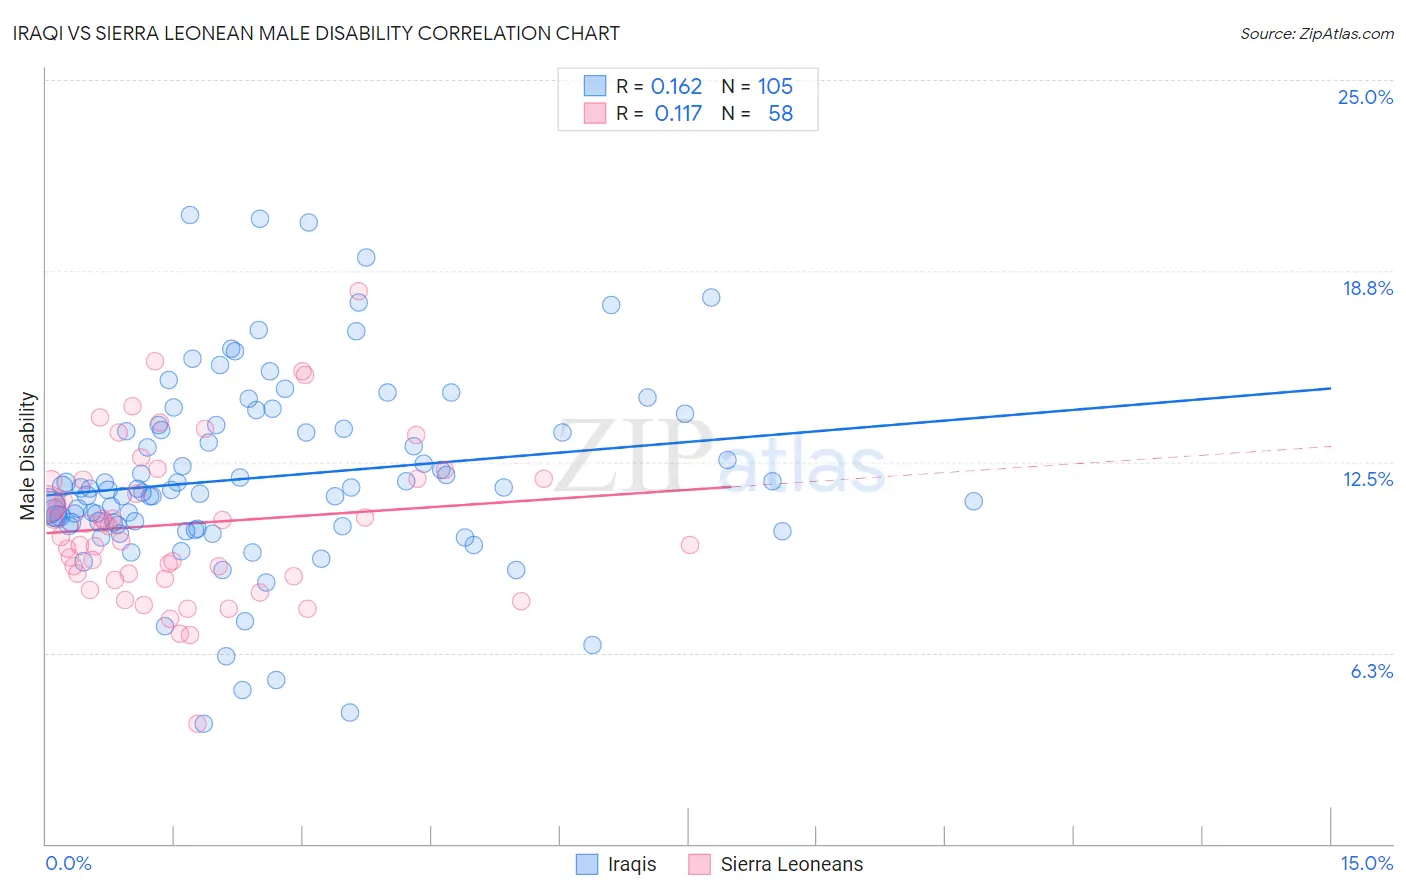
Iraqi vs Sierra Leonean Male Disability Correlation Chart
The statistical analysis conducted on geographies consisting of 170,656,152 people shows a poor positive correlation between the proportion of Iraqis and percentage of males with a disability in the United States with a correlation coefficient (R) of 0.162 and weighted average of 11.3%. Similarly, the statistical analysis conducted on geographies consisting of 83,361,010 people shows a poor positive correlation between the proportion of Sierra Leoneans and percentage of males with a disability in the United States with a correlation coefficient (R) of 0.117 and weighted average of 10.5%, a difference of 7.6%.
Male Disability Correlation Summary
| Measurement | Iraqi | Sierra Leonean |
| Minimum | 3.9% | 3.9% |
| Maximum | 20.6% | 18.1% |
| Range | 16.7% | 14.2% |
| Mean | 12.0% | 10.5% |
| Median | 11.6% | 10.2% |
| Interquartile 25% (IQ1) | 10.4% | 8.8% |
| Interquartile 75% (IQ3) | 13.6% | 11.9% |
| Interquartile Range (IQR) | 3.2% | 3.2% |
| Standard Deviation (Sample) | 3.1% | 2.6% |
| Standard Deviation (Population) | 3.1% | 2.6% |
Similar Demographics by Male Disability
Demographics Similar to Iraqis by Male Disability
In terms of male disability, the demographic groups most similar to Iraqis are Pakistani (11.3%, a difference of 0.010%), Immigrants from Central America (11.3%, a difference of 0.15%), Immigrants from Zaire (11.4%, a difference of 0.19%), Immigrants from Belize (11.3%, a difference of 0.20%), and Immigrants from Austria (11.4%, a difference of 0.21%).
| Demographics | Rating | Rank | Male Disability |
| Immigrants | Norway | 44.2 /100 | #177 | Average 11.3% |
| Australians | 42.2 /100 | #178 | Average 11.3% |
| Immigrants | Caribbean | 41.4 /100 | #179 | Average 11.3% |
| Hondurans | 41.1 /100 | #180 | Average 11.3% |
| Immigrants | Senegal | 34.4 /100 | #181 | Fair 11.3% |
| Immigrants | Belize | 33.7 /100 | #182 | Fair 11.3% |
| Immigrants | Central America | 32.9 /100 | #183 | Fair 11.3% |
| Iraqis | 30.5 /100 | #184 | Fair 11.3% |
| Pakistanis | 30.3 /100 | #185 | Fair 11.3% |
| Immigrants | Zaire | 27.6 /100 | #186 | Fair 11.4% |
| Immigrants | Austria | 27.3 /100 | #187 | Fair 11.4% |
| Estonians | 26.8 /100 | #188 | Fair 11.4% |
| Immigrants | Netherlands | 25.9 /100 | #189 | Fair 11.4% |
| Immigrants | Bosnia and Herzegovina | 25.4 /100 | #190 | Fair 11.4% |
| Senegalese | 23.2 /100 | #191 | Fair 11.4% |
Demographics Similar to Sierra Leoneans by Male Disability
In terms of male disability, the demographic groups most similar to Sierra Leoneans are Immigrants from Sierra Leone (10.5%, a difference of 0.040%), Laotian (10.6%, a difference of 0.10%), Immigrants from Lebanon (10.5%, a difference of 0.12%), Immigrants from Russia (10.6%, a difference of 0.12%), and Immigrants from Lithuania (10.5%, a difference of 0.26%).
| Demographics | Rating | Rank | Male Disability |
| Colombians | 99.2 /100 | #68 | Exceptional 10.5% |
| Ecuadorians | 99.2 /100 | #69 | Exceptional 10.5% |
| Immigrants | Bulgaria | 99.1 /100 | #70 | Exceptional 10.5% |
| Immigrants | Cameroon | 99.0 /100 | #71 | Exceptional 10.5% |
| Immigrants | Serbia | 99.0 /100 | #72 | Exceptional 10.5% |
| Immigrants | Lithuania | 98.9 /100 | #73 | Exceptional 10.5% |
| Immigrants | Lebanon | 98.8 /100 | #74 | Exceptional 10.5% |
| Sierra Leoneans | 98.7 /100 | #75 | Exceptional 10.5% |
| Immigrants | Sierra Leone | 98.7 /100 | #76 | Exceptional 10.5% |
| Laotians | 98.6 /100 | #77 | Exceptional 10.6% |
| Immigrants | Russia | 98.6 /100 | #78 | Exceptional 10.6% |
| Zimbabweans | 98.4 /100 | #79 | Exceptional 10.6% |
| Immigrants | Jordan | 98.4 /100 | #80 | Exceptional 10.6% |
| Immigrants | Chile | 98.3 /100 | #81 | Exceptional 10.6% |
| Immigrants | Guyana | 98.2 /100 | #82 | Exceptional 10.6% |