Iraqi vs Immigrants from North Macedonia Unemployment Among Ages 35 to 44 years

COMPARE

Iraqi
Race
Ancestry
AfghanAfricanAlaska NativeAlaskan AthabascanAlbanianAleutAlsatianAmericanApacheArabArapahoArgentineanArmenianAssyrian/Chaldean/SyriacAustralianAustrianBahamianBangladeshiBarbadianBasqueBelgianBelizeanBermudanBhutaneseBlackfeetBolivianBrazilianBritishBritish West IndianBulgarianBurmeseCajunCambodianCanadianCape VerdeanCarpatho RusynCelticCentral AmericanCentral American IndianCherokeeCheyenneChickasawChileanChineseChippewaChoctawColombianColvilleComancheCosta RicanCreeCreekCroatianCrowCubanCypriotCzechCzechoslovakianDanishDelawareDominicanDutchDutch West IndianEastern EuropeanEcuadorianEgyptianEnglishEstonianEthiopianEuropeanFijianFilipinoFinnishFrenchFrench American IndianFrench CanadianGermanGerman RussianGhanaianGreekGuamanian/ChamorroGuatemalanGuyaneseHaitianHmongHonduranHopiHoumaHungarianIcelanderIndian (Asian)IndonesianInupiatIranianIraqiIrishIroquoisIsraeliItalianJamaicanJapaneseJordanianKenyanKiowaKoreanLaotianLatvianLebaneseLiberianLithuanianLumbeeLuxembourgerMacedonianMalaysianMalteseMarshalleseMenomineeMexicanMexican American IndianMongolianMoroccanNative HawaiianNavajoNepaleseNew ZealanderNicaraguanNigerianNorthern EuropeanNorwegianOkinawanOsageOttawaPaiutePakistaniPalestinianPanamanianParaguayanPennsylvania GermanPeruvianPimaPolishPortuguesePotawatomiPuebloPuerto RicanPuget Sound SalishRomanianRussianSalvadoranSamoanScandinavianScotch-IrishScottishSeminoleSenegaleseSerbianShoshoneSierra LeoneanSiouxSlavicSlovakSloveneSomaliSouth AfricanSouth AmericanSouth American IndianSoviet UnionSpaniardSpanishSpanish AmericanSpanish American IndianSri LankanSubsaharan AfricanSudaneseSwedishSwissSyrianTaiwaneseThaiTlingit-HaidaTohono O'OdhamTonganTrinidadian and TobagonianTsimshianTurkishU.S. Virgin IslanderUgandanUkrainianUruguayanUteVenezuelanVietnameseWelshWest IndianYakamaYaquiYugoslavianYumanYup'ikZimbabwean
Immigration
NonimmigrantsImmigrantsAfghanistanAfricaAlbaniaArgentinaArmeniaAsiaAustraliaAustriaBahamasBangladeshBarbadosBelarusBelgiumBelizeBoliviaBosnia and HerzegovinaBrazilBulgariaBurma/MyanmarCabo VerdeCambodiaCameroonCanadaCaribbeanCentral AmericaChileChinaColombiaCongoCosta RicaCroatiaCubaCzechoslovakiaDenmarkDominicaDominican RepublicEastern AfricaEastern AsiaEastern EuropeEcuadorEgyptEl SalvadorEnglandEritreaEthiopiaEuropeFijiFranceGermanyGhanaGreeceGrenadaGuatemalaGuyanaHaitiHondurasHong KongHungaryIndiaIndonesiaIranIraqIrelandIsraelItalyJamaicaJapanJordanKazakhstanKenyaKoreaKuwaitLaosLatin AmericaLatviaLebanonLiberiaLithuaniaMalaysiaMexicoMicronesiaMiddle AfricaMoldovaMoroccoNepalNetherlandsNicaraguaNigeriaNorth AmericaNorthern AfricaNorthern EuropeNorwayOceaniaPakistanPanamaPeruPhilippinesPolandPortugalRomaniaRussiaSaudi ArabiaScotlandSenegalSerbiaSierra LeoneSingaporeSomaliaSouth AfricaSouth AmericaSouth Central AsiaSouth Eastern AsiaSouthern EuropeSpainSri LankaSt. Vincent and the GrenadinesSudanSwedenSwitzerlandSyriaTaiwanThailandTrinidad and TobagoTurkeyUgandaUkraineUruguayUzbekistanVenezuelaVietnamWest IndiesWestern AfricaWestern AsiaWestern EuropeYemenZaireZimbabweAzores
Immigrants from North Macedonia
Race
Ancestry
AfghanAfricanAlaska NativeAlaskan AthabascanAlbanianAleutAlsatianAmericanApacheArabArapahoArgentineanArmenianAssyrian/Chaldean/SyriacAustralianAustrianBahamianBangladeshiBarbadianBasqueBelgianBelizeanBermudanBhutaneseBlackfeetBolivianBrazilianBritishBritish West IndianBulgarianBurmeseCajunCambodianCanadianCape VerdeanCarpatho RusynCelticCentral AmericanCentral American IndianCherokeeCheyenneChickasawChileanChineseChippewaChoctawColombianColvilleComancheCosta RicanCreeCreekCroatianCrowCubanCypriotCzechCzechoslovakianDanishDelawareDominicanDutchDutch West IndianEastern EuropeanEcuadorianEgyptianEnglishEstonianEthiopianEuropeanFijianFilipinoFinnishFrenchFrench American IndianFrench CanadianGermanGerman RussianGhanaianGreekGuamanian/ChamorroGuatemalanGuyaneseHaitianHmongHonduranHopiHoumaHungarianIcelanderIndian (Asian)IndonesianInupiatIranianIrishIroquoisIsraeliItalianJamaicanJapaneseJordanianKenyanKiowaKoreanLaotianLatvianLebaneseLiberianLithuanianLumbeeLuxembourgerMacedonianMalaysianMalteseMarshalleseMenomineeMexicanMexican American IndianMongolianMoroccanNative HawaiianNavajoNepaleseNew ZealanderNicaraguanNigerianNorthern EuropeanNorwegianOkinawanOsageOttawaPaiutePakistaniPalestinianPanamanianParaguayanPennsylvania GermanPeruvianPimaPolishPortuguesePotawatomiPuebloPuerto RicanPuget Sound SalishRomanianRussianSalvadoranSamoanScandinavianScotch-IrishScottishSeminoleSenegaleseSerbianShoshoneSierra LeoneanSiouxSlavicSlovakSloveneSomaliSouth AfricanSouth AmericanSouth American IndianSoviet UnionSpaniardSpanishSpanish AmericanSpanish American IndianSri LankanSubsaharan AfricanSudaneseSwedishSwissSyrianTaiwaneseThaiTlingit-HaidaTohono O'OdhamTonganTrinidadian and TobagonianTsimshianTurkishU.S. Virgin IslanderUgandanUkrainianUruguayanUteVenezuelanVietnameseWelshWest IndianYakamaYaquiYugoslavianYumanYup'ikZimbabwean
Immigration
NonimmigrantsImmigrantsAfghanistanAfricaAlbaniaArgentinaArmeniaAsiaAustraliaAustriaBahamasBangladeshBarbadosBelarusBelgiumBelizeBoliviaBosnia and HerzegovinaBrazilBulgariaBurma/MyanmarCabo VerdeCambodiaCameroonCanadaCaribbeanCentral AmericaChileChinaColombiaCongoCosta RicaCroatiaCubaCzechoslovakiaDenmarkDominicaDominican RepublicEastern AfricaEastern AsiaEastern EuropeEcuadorEgyptEl SalvadorEnglandEritreaEthiopiaEuropeFijiFranceGermanyGhanaGreeceGrenadaGuatemalaGuyanaHaitiHondurasHong KongHungaryIndiaIndonesiaIranIraqIrelandIsraelItalyJamaicaJapanJordanKazakhstanKenyaKoreaKuwaitLaosLatin AmericaLatviaLebanonLiberiaLithuaniaMalaysiaMexicoMicronesiaMiddle AfricaMoldovaMoroccoNepalNetherlandsNicaraguaNigeriaNorth AmericaNorth MacedoniaNorthern AfricaNorthern EuropeNorwayOceaniaPakistanPanamaPeruPhilippinesPolandPortugalRomaniaRussiaSaudi ArabiaScotlandSenegalSerbiaSierra LeoneSingaporeSomaliaSouth AfricaSouth AmericaSouth Central AsiaSouth Eastern AsiaSouthern EuropeSpainSri LankaSt. Vincent and the GrenadinesSudanSwedenSwitzerlandSyriaTaiwanThailandTrinidad and TobagoTurkeyUgandaUkraineUruguayUzbekistanVenezuelaVietnamWest IndiesWestern AfricaWestern AsiaWestern EuropeYemenZaireZimbabweAzores
Unemployment Among Ages 35 to 44 years
Income
Poverty
Unemployment
Labor Participation
Family Structure
Vehicle Availability
Education Level
Disability

Unemployment Among Ages 35 to 44 years Comparison

Iraqis

Immigrants from North Macedonia

Average
Exceptional
4.7%
UNEMPLOYMENT AMONG AGES 35 TO 44 YEARS
50.9/ 100
METRIC RATING
173rd/ 347
METRIC RANK
4.5%
UNEMPLOYMENT AMONG AGES 35 TO 44 YEARS
90.7/ 100
METRIC RATING
107th/ 347
METRIC RANK

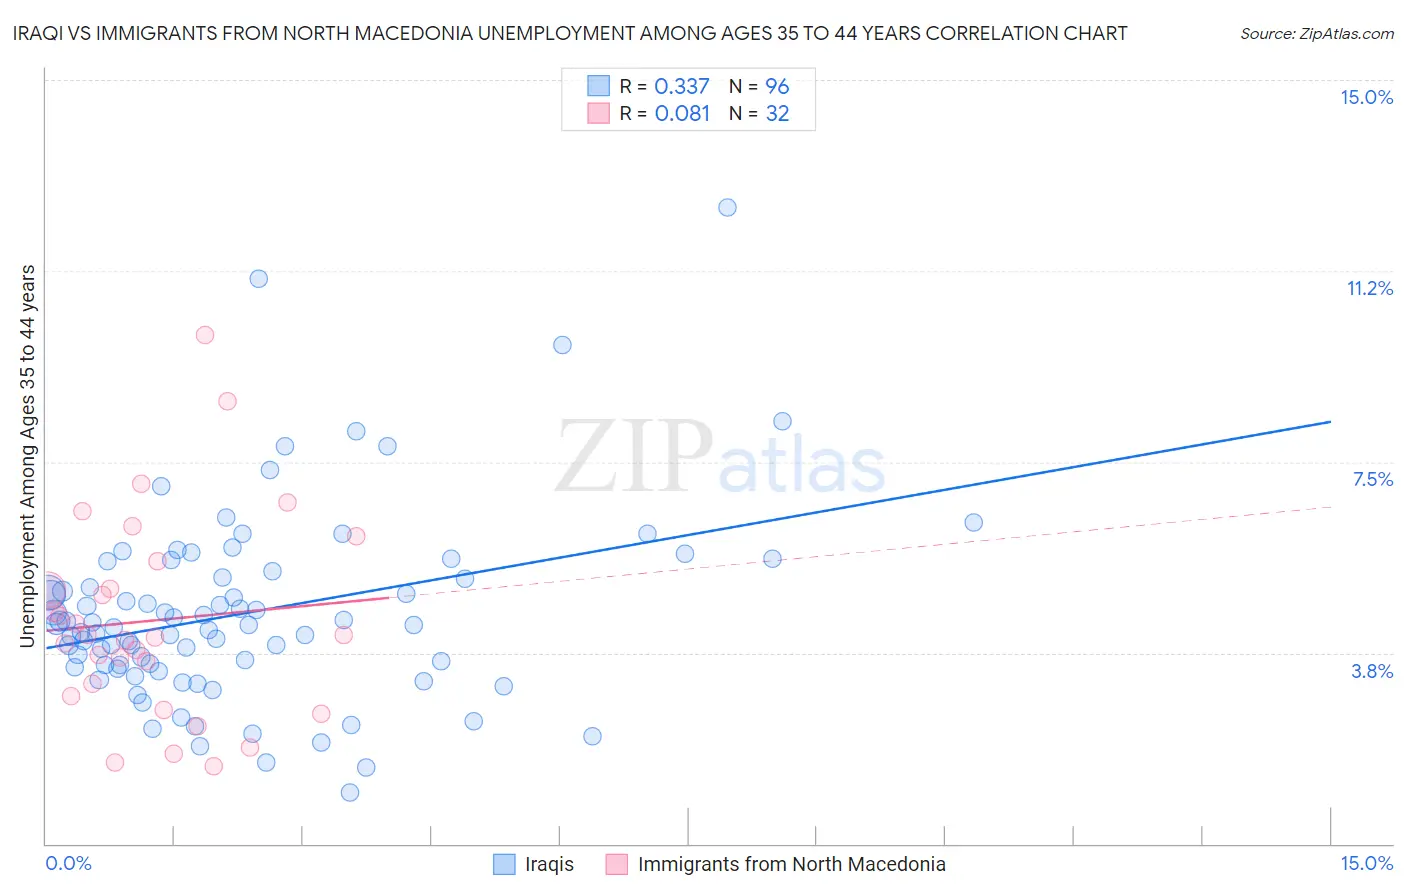
Iraqi vs Immigrants from North Macedonia Unemployment Among Ages 35 to 44 years Correlation Chart

The statistical analysis conducted on geographies consisting of 169,697,625 people shows a mild positive correlation between the proportion of Iraqis and unemployment rate among population between the ages 35 and 44 in the United States with a correlation coefficient (R) of 0.337 and weighted average of 4.7%. Similarly, the statistical analysis conducted on geographies consisting of 73,898,885 people shows a slight positive correlation between the proportion of Immigrants from North Macedonia and unemployment rate among population between the ages 35 and 44 in the United States with a correlation coefficient (R) of 0.081 and weighted average of 4.5%, a difference of 4.2%.
Iraqi vs Immigrants from North Macedonia Unemployment Among Ages 35 to 44 years

Unemployment Among Ages 35 to 44 years Correlation Summary

MeasurementIraqiImmigrants from North Macedonia
Minimum1.0%1.5%
Maximum12.5%10.0%
Range11.5%8.5%
Mean4.5%4.4%
Median4.3%4.1%
Interquartile 25% (IQ1)3.5%3.0%
Interquartile 75% (IQ3)5.3%5.3%
Interquartile Range (IQR)1.8%2.3%
Standard Deviation (Sample)1.9%2.0%
Standard Deviation (Population)1.9%2.0%

Similar Demographics by Unemployment Among Ages 35 to 44 years

Demographics Similar to Iraqis by Unemployment Among Ages 35 to 44 years

In terms of unemployment among ages 35 to 44 years, the demographic groups most similar to Iraqis are Lebanese (4.7%, a difference of 0.040%), Indonesian (4.7%, a difference of 0.060%), Afghan (4.7%, a difference of 0.060%), Immigrants from Indonesia (4.7%, a difference of 0.12%), and Immigrants from Germany (4.7%, a difference of 0.14%).
DemographicsRating | RankUnemployment Among Ages 35 to 44 years
French
55.6
/100
|
#166
Average
4.7%
Peruvians
54.4
/100
|
#167
Average
4.7%
Arabs
53.1
/100
|
#168
Average
4.7%
Pennsylvania Germans
53.0
/100
|
#169
Average
4.7%
Immigrants | Indonesia
52.6
/100
|
#170
Average
4.7%
Indonesians
51.7
/100
|
#171
Average
4.7%
Lebanese
51.4
/100
|
#172
Average
4.7%
Iraqis
50.9
/100
|
#173
Average
4.7%
Afghans
50.0
/100
|
#174
Average
4.7%
Immigrants | Germany
48.9
/100
|
#175
Average
4.7%
Immigrants | Uganda
48.1
/100
|
#176
Average
4.7%
Slovaks
44.6
/100
|
#177
Average
4.7%
South American Indians
40.7
/100
|
#178
Average
4.7%
Immigrants | South Eastern Asia
40.2
/100
|
#179
Average
4.7%
Immigrants | Peru
39.9
/100
|
#180
Fair
4.7%

Demographics Similar to Immigrants from North Macedonia by Unemployment Among Ages 35 to 44 years

In terms of unemployment among ages 35 to 44 years, the demographic groups most similar to Immigrants from North Macedonia are Immigrants from North America (4.5%, a difference of 0.090%), New Zealander (4.5%, a difference of 0.090%), Romanian (4.5%, a difference of 0.090%), Immigrants from Saudi Arabia (4.5%, a difference of 0.13%), and Immigrants from Kazakhstan (4.5%, a difference of 0.16%).
DemographicsRating | RankUnemployment Among Ages 35 to 44 years
Italians
91.9
/100
|
#100
Exceptional
4.5%
Immigrants | Netherlands
91.9
/100
|
#101
Exceptional
4.5%
Immigrants | Sudan
91.8
/100
|
#102
Exceptional
4.5%
Welsh
91.6
/100
|
#103
Exceptional
4.5%
Finns
91.6
/100
|
#104
Exceptional
4.5%
Immigrants | Saudi Arabia
91.3
/100
|
#105
Exceptional
4.5%
Immigrants | North America
91.1
/100
|
#106
Exceptional
4.5%
Immigrants | North Macedonia
90.7
/100
|
#107
Exceptional
4.5%
New Zealanders
90.3
/100
|
#108
Exceptional
4.5%
Romanians
90.3
/100
|
#109
Exceptional
4.5%
Immigrants | Kazakhstan
90.0
/100
|
#110
Excellent
4.5%
Immigrants | Nicaragua
89.8
/100
|
#111
Excellent
4.5%
Immigrants | Czechoslovakia
89.2
/100
|
#112
Excellent
4.5%
Immigrants | Italy
88.4
/100
|
#113
Excellent
4.5%
Macedonians
88.3
/100
|
#114
Excellent
4.5%