Bahamian vs Menominee Female Disability
COMPARE
Bahamian
Menominee
Female Disability
Female Disability Comparison
Bahamians
Menominee
12.4%
FEMALE DISABILITY
11.1/ 100
METRIC RATING
220th/ 347
METRIC RANK
12.6%
FEMALE DISABILITY
2.1/ 100
METRIC RATING
247th/ 347
METRIC RANK
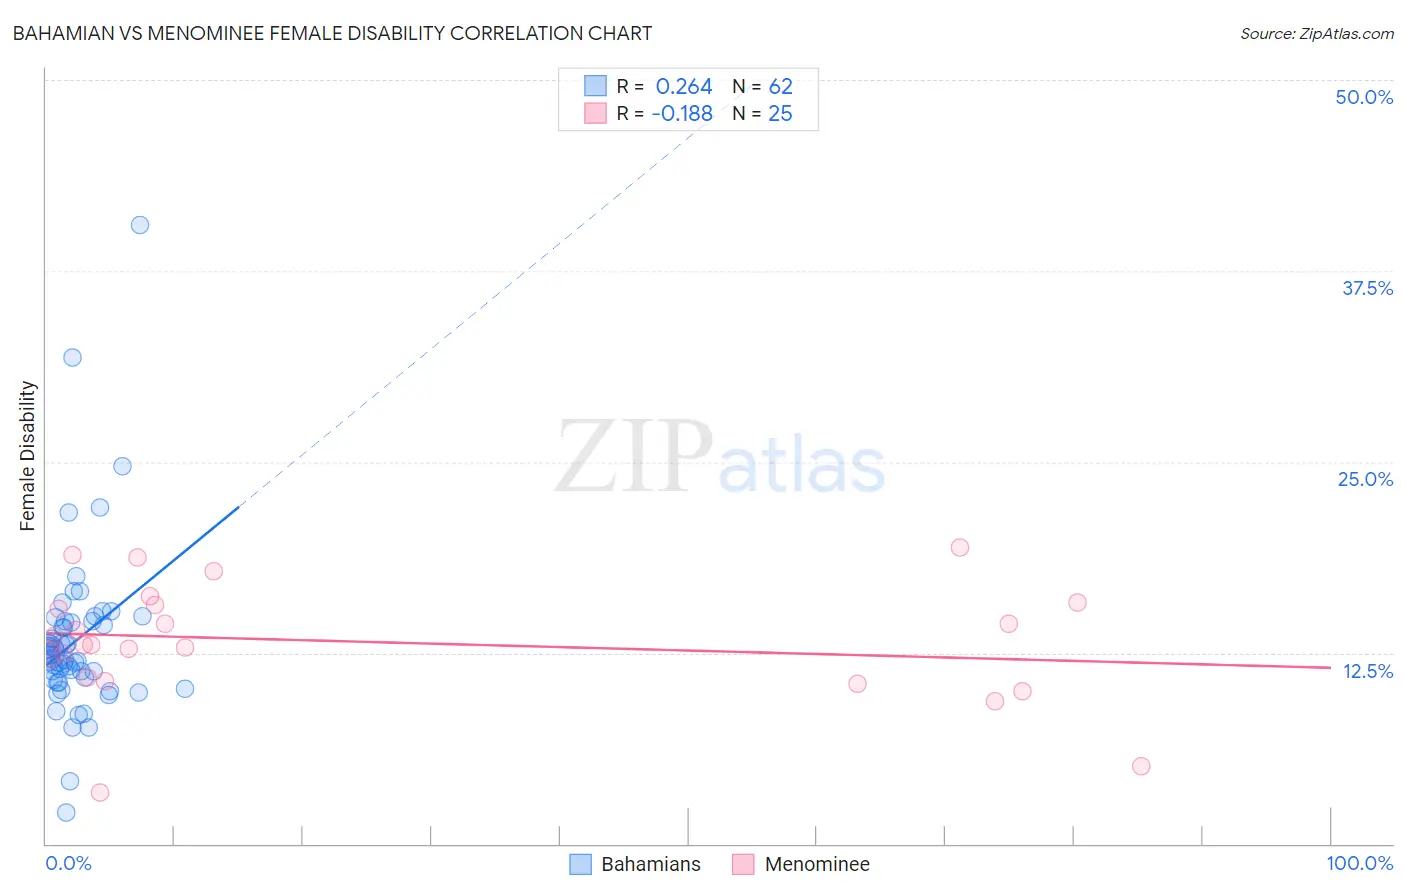
Bahamian vs Menominee Female Disability Correlation Chart
The statistical analysis conducted on geographies consisting of 112,675,688 people shows a weak positive correlation between the proportion of Bahamians and percentage of females with a disability in the United States with a correlation coefficient (R) of 0.264 and weighted average of 12.4%. Similarly, the statistical analysis conducted on geographies consisting of 45,777,730 people shows a poor negative correlation between the proportion of Menominee and percentage of females with a disability in the United States with a correlation coefficient (R) of -0.188 and weighted average of 12.6%, a difference of 1.6%.
Female Disability Correlation Summary
| Measurement | Bahamian | Menominee |
| Minimum | 2.1% | 3.4% |
| Maximum | 40.5% | 19.4% |
| Range | 38.4% | 16.0% |
| Mean | 13.3% | 13.2% |
| Median | 12.4% | 13.0% |
| Interquartile 25% (IQ1) | 10.8% | 10.8% |
| Interquartile 75% (IQ3) | 14.5% | 15.7% |
| Interquartile Range (IQR) | 3.8% | 5.0% |
| Standard Deviation (Sample) | 5.6% | 3.9% |
| Standard Deviation (Population) | 5.5% | 3.8% |
Similar Demographics by Female Disability
Demographics Similar to Bahamians by Female Disability
In terms of female disability, the demographic groups most similar to Bahamians are Native Hawaiian (12.4%, a difference of 0.030%), Italian (12.4%, a difference of 0.040%), European (12.4%, a difference of 0.090%), Immigrants from Bahamas (12.4%, a difference of 0.12%), and British (12.4%, a difference of 0.14%).
| Demographics | Rating | Rank | Female Disability |
| Immigrants | Thailand | 14.5 /100 | #213 | Poor 12.4% |
| Panamanians | 13.5 /100 | #214 | Poor 12.4% |
| Samoans | 13.4 /100 | #215 | Poor 12.4% |
| Immigrants | Burma/Myanmar | 13.3 /100 | #216 | Poor 12.4% |
| British | 12.7 /100 | #217 | Poor 12.4% |
| Immigrants | Bahamas | 12.5 /100 | #218 | Poor 12.4% |
| Europeans | 12.1 /100 | #219 | Poor 12.4% |
| Bahamians | 11.1 /100 | #220 | Poor 12.4% |
| Native Hawaiians | 10.8 /100 | #221 | Poor 12.4% |
| Italians | 10.7 /100 | #222 | Poor 12.4% |
| Guamanians/Chamorros | 9.5 /100 | #223 | Tragic 12.5% |
| Belizeans | 9.3 /100 | #224 | Tragic 12.5% |
| Poles | 8.4 /100 | #225 | Tragic 12.5% |
| Hispanics or Latinos | 8.0 /100 | #226 | Tragic 12.5% |
| Assyrians/Chaldeans/Syriacs | 8.0 /100 | #227 | Tragic 12.5% |
Demographics Similar to Menominee by Female Disability
In terms of female disability, the demographic groups most similar to Menominee are Spanish American Indian (12.6%, a difference of 0.010%), Immigrants from Jamaica (12.6%, a difference of 0.030%), Carpatho Rusyn (12.6%, a difference of 0.040%), Alsatian (12.6%, a difference of 0.16%), and Immigrants from Congo (12.7%, a difference of 0.16%).
| Demographics | Rating | Rank | Female Disability |
| German Russians | 3.2 /100 | #240 | Tragic 12.6% |
| Japanese | 2.7 /100 | #241 | Tragic 12.6% |
| Canadians | 2.6 /100 | #242 | Tragic 12.6% |
| Immigrants | Senegal | 2.5 /100 | #243 | Tragic 12.6% |
| Alsatians | 2.5 /100 | #244 | Tragic 12.6% |
| Immigrants | Jamaica | 2.2 /100 | #245 | Tragic 12.6% |
| Spanish American Indians | 2.1 /100 | #246 | Tragic 12.6% |
| Menominee | 2.1 /100 | #247 | Tragic 12.6% |
| Carpatho Rusyns | 2.0 /100 | #248 | Tragic 12.6% |
| Immigrants | Congo | 1.8 /100 | #249 | Tragic 12.7% |
| Slovenes | 1.7 /100 | #250 | Tragic 12.7% |
| Crow | 1.6 /100 | #251 | Tragic 12.7% |
| Immigrants | Caribbean | 1.4 /100 | #252 | Tragic 12.7% |
| Jamaicans | 1.4 /100 | #253 | Tragic 12.7% |
| Hawaiians | 1.4 /100 | #254 | Tragic 12.7% |