Immigrants from Cambodia vs Menominee Female Disability
COMPARE
Immigrants from Cambodia
Menominee
Female Disability
Female Disability Comparison
Immigrants from Cambodia
Menominee
12.5%
FEMALE DISABILITY
7.8/ 100
METRIC RATING
228th/ 347
METRIC RANK
12.6%
FEMALE DISABILITY
2.1/ 100
METRIC RATING
247th/ 347
METRIC RANK
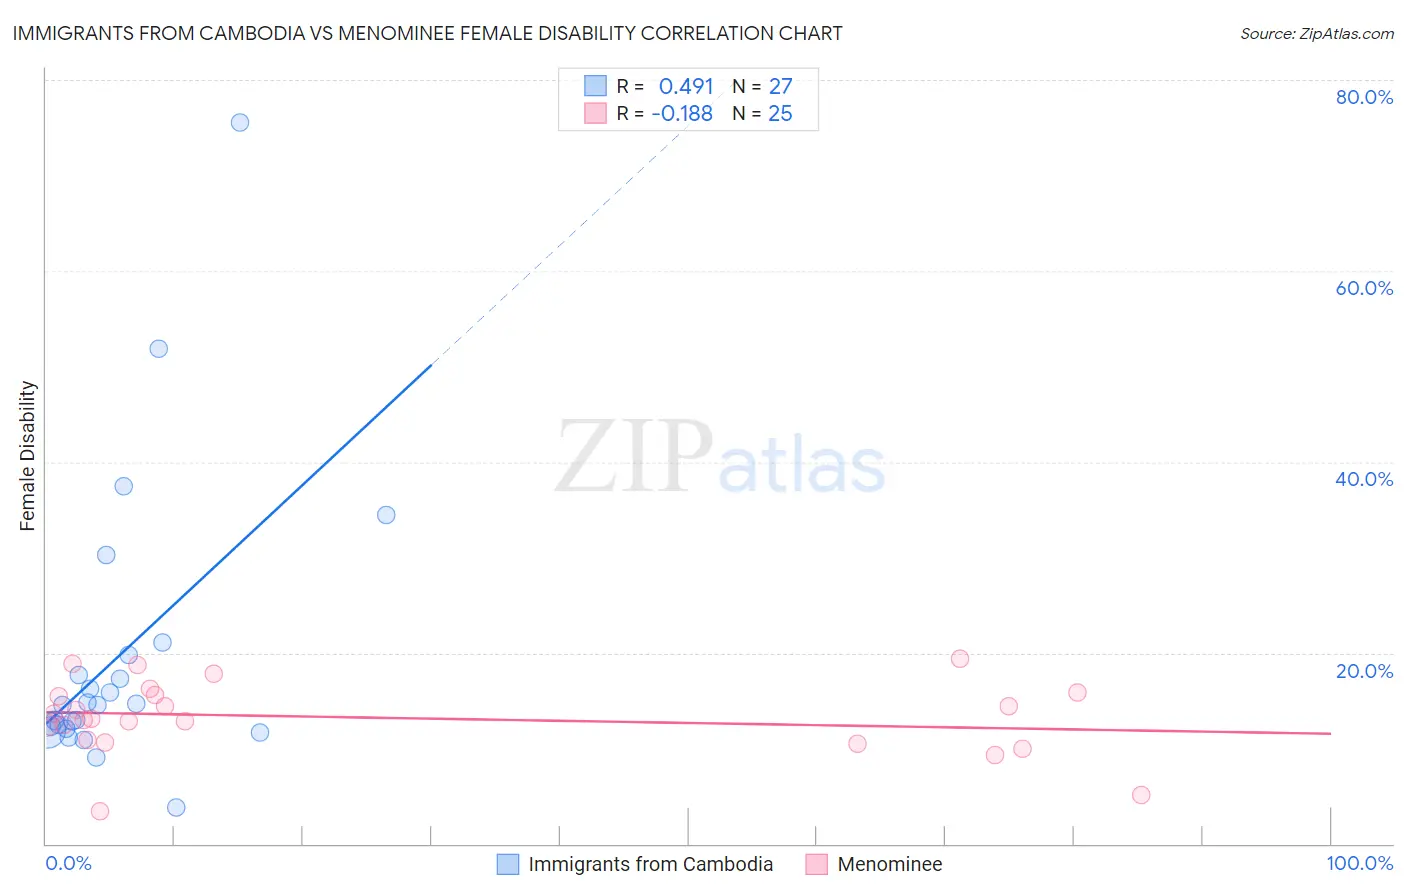
Immigrants from Cambodia vs Menominee Female Disability Correlation Chart
The statistical analysis conducted on geographies consisting of 205,152,256 people shows a moderate positive correlation between the proportion of Immigrants from Cambodia and percentage of females with a disability in the United States with a correlation coefficient (R) of 0.491 and weighted average of 12.5%. Similarly, the statistical analysis conducted on geographies consisting of 45,777,730 people shows a poor negative correlation between the proportion of Menominee and percentage of females with a disability in the United States with a correlation coefficient (R) of -0.188 and weighted average of 12.6%, a difference of 1.3%.
Female Disability Correlation Summary
| Measurement | Immigrants from Cambodia | Menominee |
| Minimum | 3.8% | 3.4% |
| Maximum | 75.5% | 19.4% |
| Range | 71.7% | 16.0% |
| Mean | 19.6% | 13.2% |
| Median | 14.5% | 13.0% |
| Interquartile 25% (IQ1) | 12.0% | 10.8% |
| Interquartile 75% (IQ3) | 19.8% | 15.7% |
| Interquartile Range (IQR) | 7.8% | 5.0% |
| Standard Deviation (Sample) | 15.0% | 3.9% |
| Standard Deviation (Population) | 14.8% | 3.8% |
Demographics Similar to Immigrants from Cambodia and Menominee by Female Disability
In terms of female disability, the demographic groups most similar to Immigrants from Cambodia are Assyrian/Chaldean/Syriac (12.5%, a difference of 0.030%), Hungarian (12.5%, a difference of 0.070%), Immigrants from Belize (12.5%, a difference of 0.11%), Belgian (12.5%, a difference of 0.18%), and Immigrants from Somalia (12.5%, a difference of 0.27%). Similarly, the demographic groups most similar to Menominee are Spanish American Indian (12.6%, a difference of 0.010%), Immigrants from Jamaica (12.6%, a difference of 0.030%), Alsatian (12.6%, a difference of 0.16%), Immigrants from Senegal (12.6%, a difference of 0.17%), and Canadian (12.6%, a difference of 0.19%).
| Demographics | Rating | Rank | Female Disability |
| Assyrians/Chaldeans/Syriacs | 8.0 /100 | #227 | Tragic 12.5% |
| Immigrants | Cambodia | 7.8 /100 | #228 | Tragic 12.5% |
| Hungarians | 7.2 /100 | #229 | Tragic 12.5% |
| Immigrants | Belize | 7.0 /100 | #230 | Tragic 12.5% |
| Belgians | 6.5 /100 | #231 | Tragic 12.5% |
| Immigrants | Somalia | 5.9 /100 | #232 | Tragic 12.5% |
| Immigrants | Iraq | 5.3 /100 | #233 | Tragic 12.5% |
| Scandinavians | 5.3 /100 | #234 | Tragic 12.5% |
| Malaysians | 5.0 /100 | #235 | Tragic 12.5% |
| Immigrants | West Indies | 4.4 /100 | #236 | Tragic 12.6% |
| Slavs | 3.8 /100 | #237 | Tragic 12.6% |
| Yugoslavians | 3.7 /100 | #238 | Tragic 12.6% |
| Barbadians | 3.6 /100 | #239 | Tragic 12.6% |
| German Russians | 3.2 /100 | #240 | Tragic 12.6% |
| Japanese | 2.7 /100 | #241 | Tragic 12.6% |
| Canadians | 2.6 /100 | #242 | Tragic 12.6% |
| Immigrants | Senegal | 2.5 /100 | #243 | Tragic 12.6% |
| Alsatians | 2.5 /100 | #244 | Tragic 12.6% |
| Immigrants | Jamaica | 2.2 /100 | #245 | Tragic 12.6% |
| Spanish American Indians | 2.1 /100 | #246 | Tragic 12.6% |
| Menominee | 2.1 /100 | #247 | Tragic 12.6% |