Iranian vs Immigrants from Trinidad and Tobago Female Disability
COMPARE
Iranian
Immigrants from Trinidad and Tobago
Female Disability
Female Disability Comparison
Iranians
Immigrants from Trinidad and Tobago
10.6%
FEMALE DISABILITY
100.0/ 100
METRIC RATING
9th/ 347
METRIC RANK
12.3%
FEMALE DISABILITY
24.7/ 100
METRIC RATING
199th/ 347
METRIC RANK
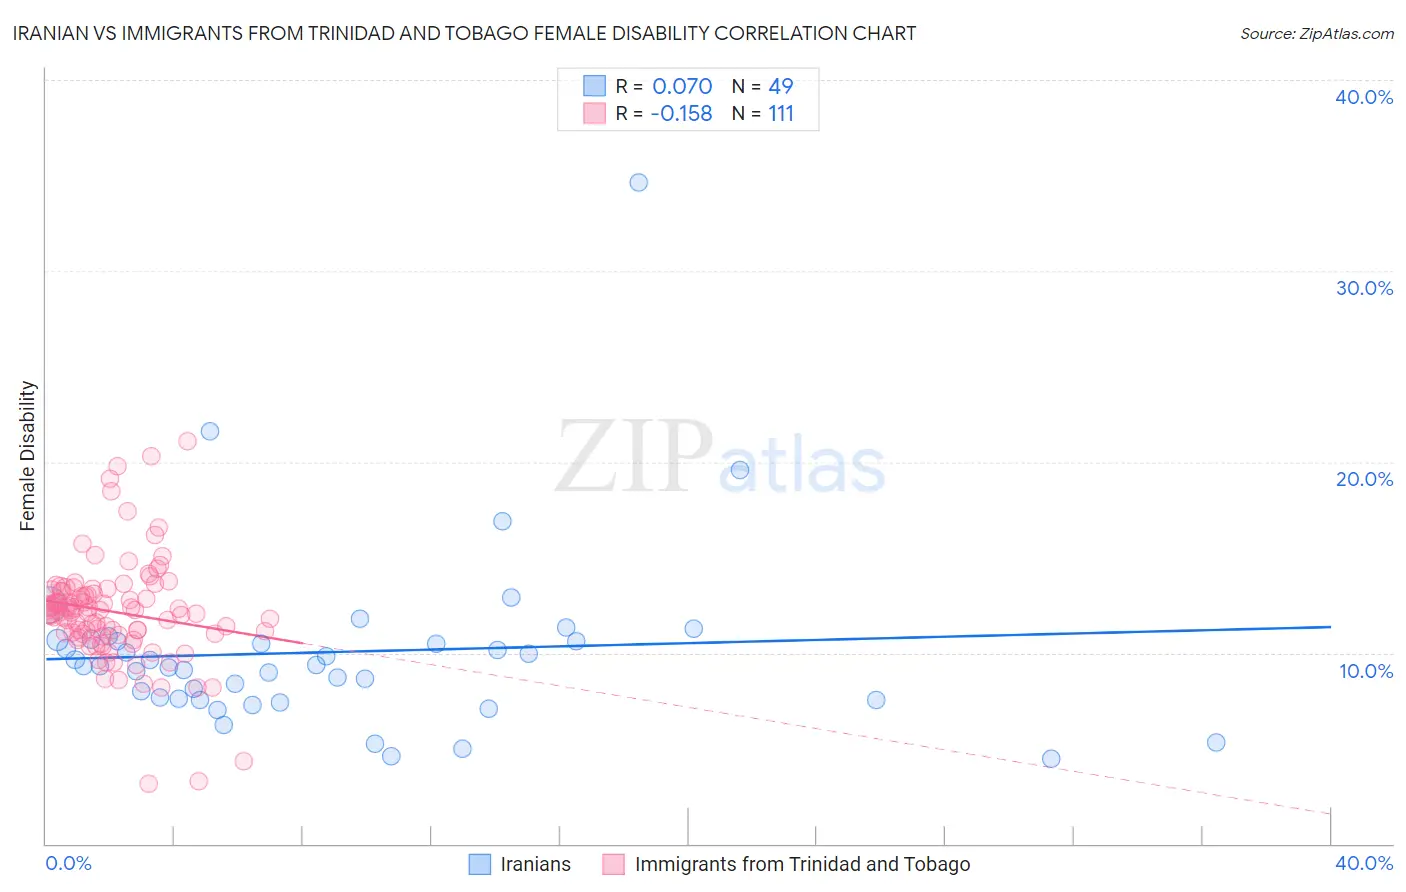
Iranian vs Immigrants from Trinidad and Tobago Female Disability Correlation Chart
The statistical analysis conducted on geographies consisting of 316,876,376 people shows a slight positive correlation between the proportion of Iranians and percentage of females with a disability in the United States with a correlation coefficient (R) of 0.070 and weighted average of 10.6%. Similarly, the statistical analysis conducted on geographies consisting of 223,503,313 people shows a poor negative correlation between the proportion of Immigrants from Trinidad and Tobago and percentage of females with a disability in the United States with a correlation coefficient (R) of -0.158 and weighted average of 12.3%, a difference of 16.8%.
Female Disability Correlation Summary
| Measurement | Iranian | Immigrants from Trinidad and Tobago |
| Minimum | 4.5% | 3.2% |
| Maximum | 34.6% | 21.1% |
| Range | 30.1% | 17.9% |
| Mean | 10.0% | 12.1% |
| Median | 9.3% | 12.1% |
| Interquartile 25% (IQ1) | 7.6% | 11.0% |
| Interquartile 75% (IQ3) | 10.6% | 13.2% |
| Interquartile Range (IQR) | 3.1% | 2.3% |
| Standard Deviation (Sample) | 4.8% | 2.8% |
| Standard Deviation (Population) | 4.8% | 2.7% |
Similar Demographics by Female Disability
Demographics Similar to Iranians by Female Disability
In terms of female disability, the demographic groups most similar to Iranians are Immigrants from Hong Kong (10.6%, a difference of 0.65%), Immigrants from Korea (10.6%, a difference of 0.82%), Immigrants from South Central Asia (10.5%, a difference of 0.91%), Immigrants from Singapore (10.4%, a difference of 1.1%), and Immigrants from Israel (10.7%, a difference of 1.2%).
| Demographics | Rating | Rank | Female Disability |
| Filipinos | 100.0 /100 | #2 | Exceptional 10.1% |
| Immigrants | Taiwan | 100.0 /100 | #3 | Exceptional 10.1% |
| Thais | 100.0 /100 | #4 | Exceptional 10.2% |
| Immigrants | Bolivia | 100.0 /100 | #5 | Exceptional 10.3% |
| Bolivians | 100.0 /100 | #6 | Exceptional 10.4% |
| Immigrants | Singapore | 100.0 /100 | #7 | Exceptional 10.4% |
| Immigrants | South Central Asia | 100.0 /100 | #8 | Exceptional 10.5% |
| Iranians | 100.0 /100 | #9 | Exceptional 10.6% |
| Immigrants | Hong Kong | 100.0 /100 | #10 | Exceptional 10.6% |
| Immigrants | Korea | 100.0 /100 | #11 | Exceptional 10.6% |
| Immigrants | Israel | 100.0 /100 | #12 | Exceptional 10.7% |
| Immigrants | Eastern Asia | 100.0 /100 | #13 | Exceptional 10.7% |
| Immigrants | China | 100.0 /100 | #14 | Exceptional 10.7% |
| Burmese | 100.0 /100 | #15 | Exceptional 10.7% |
| Okinawans | 100.0 /100 | #16 | Exceptional 10.8% |
Demographics Similar to Immigrants from Trinidad and Tobago by Female Disability
In terms of female disability, the demographic groups most similar to Immigrants from Trinidad and Tobago are Mexican American Indian (12.3%, a difference of 0.010%), Immigrants from Panama (12.3%, a difference of 0.040%), Honduran (12.3%, a difference of 0.040%), Swedish (12.3%, a difference of 0.10%), and Ukrainian (12.3%, a difference of 0.12%).
| Demographics | Rating | Rank | Female Disability |
| Immigrants | Western Africa | 29.2 /100 | #192 | Fair 12.3% |
| Northern Europeans | 27.5 /100 | #193 | Fair 12.3% |
| Ukrainians | 27.2 /100 | #194 | Fair 12.3% |
| Swedes | 26.6 /100 | #195 | Fair 12.3% |
| Immigrants | Panama | 25.5 /100 | #196 | Fair 12.3% |
| Hondurans | 25.4 /100 | #197 | Fair 12.3% |
| Mexican American Indians | 24.9 /100 | #198 | Fair 12.3% |
| Immigrants | Trinidad and Tobago | 24.7 /100 | #199 | Fair 12.3% |
| Trinidadians and Tobagonians | 22.4 /100 | #200 | Fair 12.3% |
| Chinese | 22.1 /100 | #201 | Fair 12.3% |
| Somalis | 21.5 /100 | #202 | Fair 12.3% |
| Immigrants | Barbados | 21.1 /100 | #203 | Fair 12.3% |
| Immigrants | Zaire | 20.9 /100 | #204 | Fair 12.3% |
| Immigrants | Grenada | 20.5 /100 | #205 | Fair 12.4% |
| Immigrants | Cuba | 20.2 /100 | #206 | Fair 12.4% |