Immigrants from Taiwan vs Menominee Female Disability
COMPARE
Immigrants from Taiwan
Menominee
Female Disability
Female Disability Comparison
Immigrants from Taiwan
Menominee
10.1%
FEMALE DISABILITY
100.0/ 100
METRIC RATING
3rd/ 347
METRIC RANK
12.6%
FEMALE DISABILITY
2.1/ 100
METRIC RATING
247th/ 347
METRIC RANK
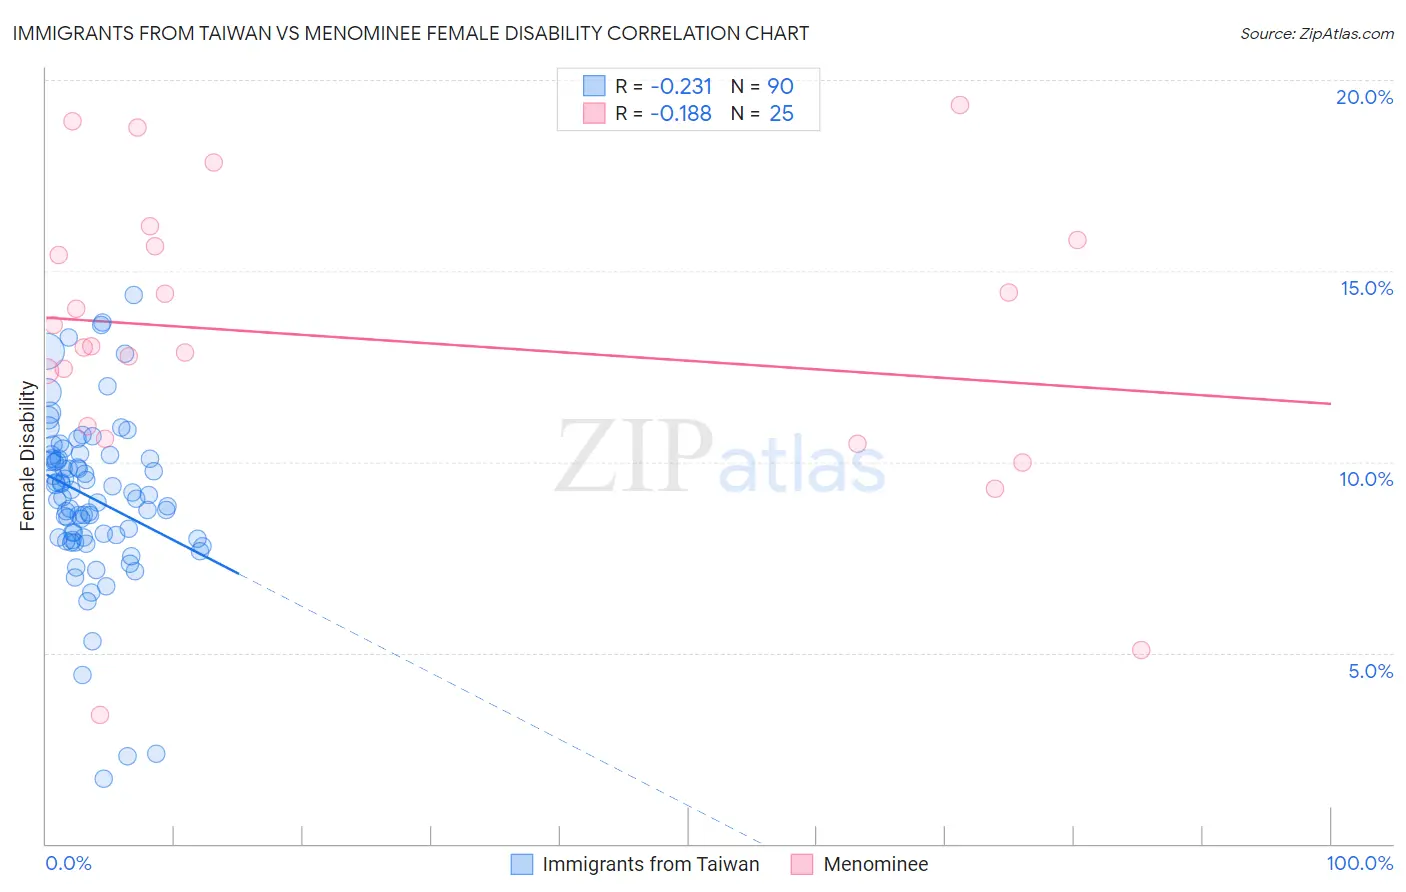
Immigrants from Taiwan vs Menominee Female Disability Correlation Chart
The statistical analysis conducted on geographies consisting of 298,238,185 people shows a weak negative correlation between the proportion of Immigrants from Taiwan and percentage of females with a disability in the United States with a correlation coefficient (R) of -0.231 and weighted average of 10.1%. Similarly, the statistical analysis conducted on geographies consisting of 45,777,730 people shows a poor negative correlation between the proportion of Menominee and percentage of females with a disability in the United States with a correlation coefficient (R) of -0.188 and weighted average of 12.6%, a difference of 25.3%.
Female Disability Correlation Summary
| Measurement | Immigrants from Taiwan | Menominee |
| Minimum | 1.7% | 3.4% |
| Maximum | 14.4% | 19.4% |
| Range | 12.7% | 16.0% |
| Mean | 9.1% | 13.2% |
| Median | 9.1% | 13.0% |
| Interquartile 25% (IQ1) | 8.0% | 10.8% |
| Interquartile 75% (IQ3) | 10.1% | 15.7% |
| Interquartile Range (IQR) | 2.1% | 5.0% |
| Standard Deviation (Sample) | 2.2% | 3.9% |
| Standard Deviation (Population) | 2.2% | 3.8% |
Similar Demographics by Female Disability
Demographics Similar to Immigrants from Taiwan by Female Disability
In terms of female disability, the demographic groups most similar to Immigrants from Taiwan are Filipino (10.1%, a difference of 0.23%), Thai (10.2%, a difference of 0.88%), Immigrants from India (10.0%, a difference of 1.2%), Immigrants from Bolivia (10.3%, a difference of 1.7%), and Bolivian (10.4%, a difference of 2.6%).
| Demographics | Rating | Rank | Female Disability |
| Immigrants | India | 100.0 /100 | #1 | Exceptional 10.0% |
| Filipinos | 100.0 /100 | #2 | Exceptional 10.1% |
| Immigrants | Taiwan | 100.0 /100 | #3 | Exceptional 10.1% |
| Thais | 100.0 /100 | #4 | Exceptional 10.2% |
| Immigrants | Bolivia | 100.0 /100 | #5 | Exceptional 10.3% |
| Bolivians | 100.0 /100 | #6 | Exceptional 10.4% |
| Immigrants | Singapore | 100.0 /100 | #7 | Exceptional 10.4% |
| Immigrants | South Central Asia | 100.0 /100 | #8 | Exceptional 10.5% |
| Iranians | 100.0 /100 | #9 | Exceptional 10.6% |
| Immigrants | Hong Kong | 100.0 /100 | #10 | Exceptional 10.6% |
| Immigrants | Korea | 100.0 /100 | #11 | Exceptional 10.6% |
| Immigrants | Israel | 100.0 /100 | #12 | Exceptional 10.7% |
| Immigrants | Eastern Asia | 100.0 /100 | #13 | Exceptional 10.7% |
| Immigrants | China | 100.0 /100 | #14 | Exceptional 10.7% |
| Burmese | 100.0 /100 | #15 | Exceptional 10.7% |
Demographics Similar to Menominee by Female Disability
In terms of female disability, the demographic groups most similar to Menominee are Spanish American Indian (12.6%, a difference of 0.010%), Immigrants from Jamaica (12.6%, a difference of 0.030%), Carpatho Rusyn (12.6%, a difference of 0.040%), Alsatian (12.6%, a difference of 0.16%), and Immigrants from Congo (12.7%, a difference of 0.16%).
| Demographics | Rating | Rank | Female Disability |
| German Russians | 3.2 /100 | #240 | Tragic 12.6% |
| Japanese | 2.7 /100 | #241 | Tragic 12.6% |
| Canadians | 2.6 /100 | #242 | Tragic 12.6% |
| Immigrants | Senegal | 2.5 /100 | #243 | Tragic 12.6% |
| Alsatians | 2.5 /100 | #244 | Tragic 12.6% |
| Immigrants | Jamaica | 2.2 /100 | #245 | Tragic 12.6% |
| Spanish American Indians | 2.1 /100 | #246 | Tragic 12.6% |
| Menominee | 2.1 /100 | #247 | Tragic 12.6% |
| Carpatho Rusyns | 2.0 /100 | #248 | Tragic 12.6% |
| Immigrants | Congo | 1.8 /100 | #249 | Tragic 12.7% |
| Slovenes | 1.7 /100 | #250 | Tragic 12.7% |
| Crow | 1.6 /100 | #251 | Tragic 12.7% |
| Immigrants | Caribbean | 1.4 /100 | #252 | Tragic 12.7% |
| Jamaicans | 1.4 /100 | #253 | Tragic 12.7% |
| Hawaiians | 1.4 /100 | #254 | Tragic 12.7% |