Slovak vs Immigrants from Singapore Cognitive Disability
COMPARE
Slovak
Immigrants from Singapore
Cognitive Disability
Cognitive Disability Comparison
Slovaks
Immigrants from Singapore
16.4%
COGNITIVE DISABILITY
99.9/ 100
METRIC RATING
35th/ 347
METRIC RANK
17.5%
COGNITIVE DISABILITY
14.3/ 100
METRIC RATING
199th/ 347
METRIC RANK
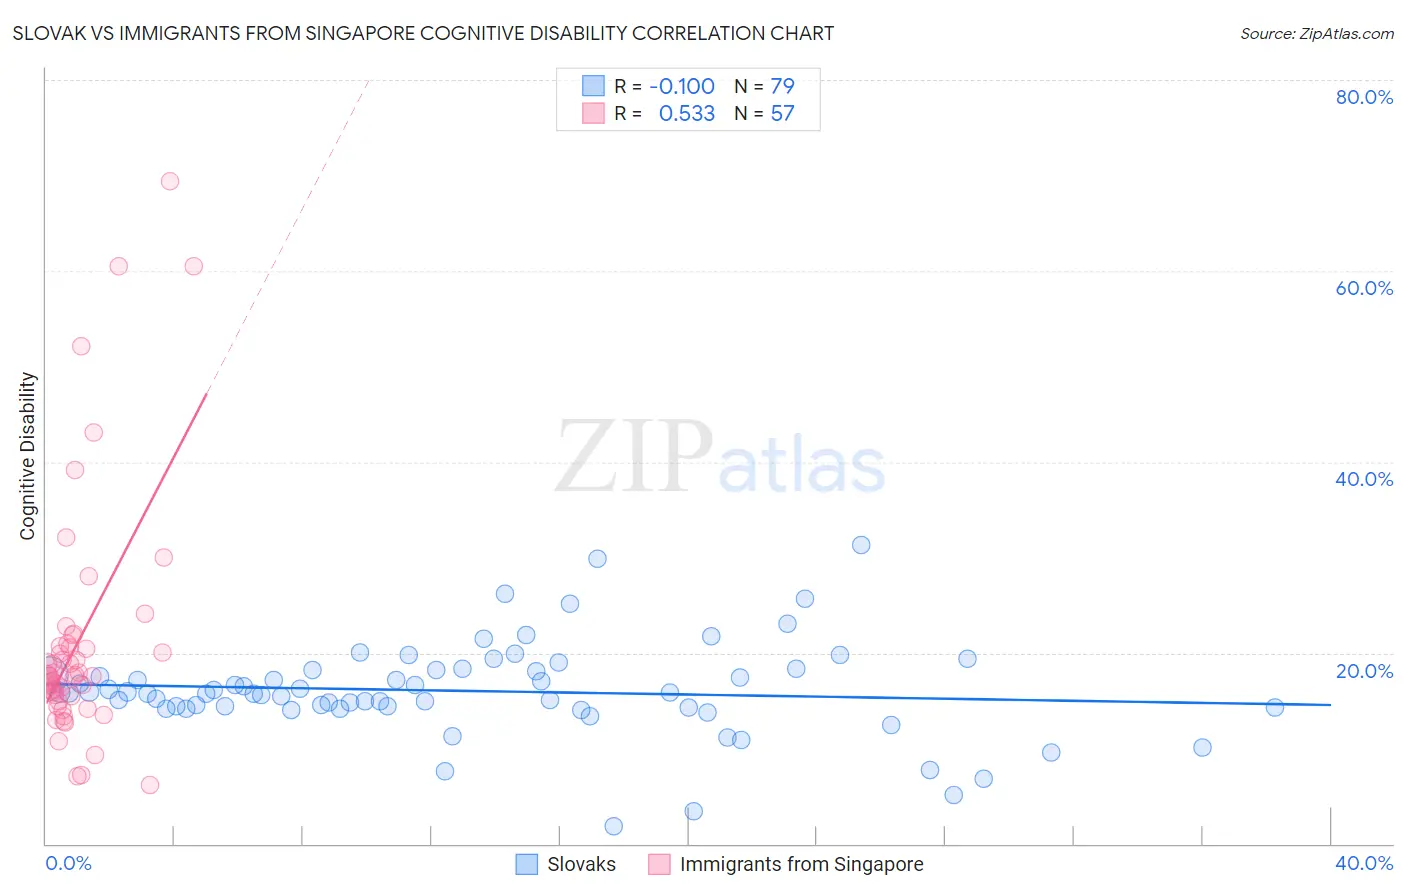
Slovak vs Immigrants from Singapore Cognitive Disability Correlation Chart
The statistical analysis conducted on geographies consisting of 397,859,059 people shows a slight negative correlation between the proportion of Slovaks and percentage of population with cognitive disability in the United States with a correlation coefficient (R) of -0.100 and weighted average of 16.4%. Similarly, the statistical analysis conducted on geographies consisting of 137,519,920 people shows a substantial positive correlation between the proportion of Immigrants from Singapore and percentage of population with cognitive disability in the United States with a correlation coefficient (R) of 0.533 and weighted average of 17.5%, a difference of 6.5%.
Cognitive Disability Correlation Summary
| Measurement | Slovak | Immigrants from Singapore |
| Minimum | 1.9% | 6.1% |
| Maximum | 31.3% | 69.3% |
| Range | 29.4% | 63.2% |
| Mean | 16.0% | 21.2% |
| Median | 15.8% | 17.6% |
| Interquartile 25% (IQ1) | 14.2% | 15.2% |
| Interquartile 75% (IQ3) | 18.2% | 20.8% |
| Interquartile Range (IQR) | 3.9% | 5.6% |
| Standard Deviation (Sample) | 4.9% | 12.8% |
| Standard Deviation (Population) | 4.9% | 12.7% |
Similar Demographics by Cognitive Disability
Demographics Similar to Slovaks by Cognitive Disability
In terms of cognitive disability, the demographic groups most similar to Slovaks are Greek (16.4%, a difference of 0.010%), Italian (16.4%, a difference of 0.080%), Russian (16.4%, a difference of 0.080%), Slovene (16.5%, a difference of 0.15%), and Immigrants from Israel (16.4%, a difference of 0.16%).
| Demographics | Rating | Rank | Cognitive Disability |
| Poles | 99.9 /100 | #28 | Exceptional 16.4% |
| Filipinos | 99.9 /100 | #29 | Exceptional 16.4% |
| Czechs | 99.9 /100 | #30 | Exceptional 16.4% |
| Immigrants | Romania | 99.9 /100 | #31 | Exceptional 16.4% |
| Immigrants | Israel | 99.9 /100 | #32 | Exceptional 16.4% |
| Italians | 99.9 /100 | #33 | Exceptional 16.4% |
| Russians | 99.9 /100 | #34 | Exceptional 16.4% |
| Slovaks | 99.9 /100 | #35 | Exceptional 16.4% |
| Greeks | 99.9 /100 | #36 | Exceptional 16.4% |
| Slovenes | 99.9 /100 | #37 | Exceptional 16.5% |
| Immigrants | Eastern Europe | 99.9 /100 | #38 | Exceptional 16.5% |
| Bolivians | 99.9 /100 | #39 | Exceptional 16.5% |
| Immigrants | Belarus | 99.9 /100 | #40 | Exceptional 16.5% |
| Cubans | 99.9 /100 | #41 | Exceptional 16.5% |
| Hungarians | 99.9 /100 | #42 | Exceptional 16.5% |
Demographics Similar to Immigrants from Singapore by Cognitive Disability
In terms of cognitive disability, the demographic groups most similar to Immigrants from Singapore are Haitian (17.5%, a difference of 0.010%), Immigrants from Panama (17.5%, a difference of 0.030%), South American Indian (17.5%, a difference of 0.080%), Immigrants from Afghanistan (17.5%, a difference of 0.13%), and Immigrants from Morocco (17.5%, a difference of 0.14%).
| Demographics | Rating | Rank | Cognitive Disability |
| Immigrants | Haiti | 27.1 /100 | #192 | Fair 17.4% |
| Delaware | 25.6 /100 | #193 | Fair 17.4% |
| Immigrants | Bosnia and Herzegovina | 22.0 /100 | #194 | Fair 17.4% |
| New Zealanders | 21.1 /100 | #195 | Fair 17.4% |
| Guyanese | 17.5 /100 | #196 | Poor 17.5% |
| Immigrants | Afghanistan | 16.7 /100 | #197 | Poor 17.5% |
| Immigrants | Panama | 14.8 /100 | #198 | Poor 17.5% |
| Immigrants | Singapore | 14.3 /100 | #199 | Poor 17.5% |
| Haitians | 14.1 /100 | #200 | Poor 17.5% |
| South American Indians | 13.0 /100 | #201 | Poor 17.5% |
| Immigrants | Morocco | 12.0 /100 | #202 | Poor 17.5% |
| Immigrants | Caribbean | 11.0 /100 | #203 | Poor 17.5% |
| Immigrants | Zimbabwe | 11.0 /100 | #204 | Poor 17.5% |
| Puget Sound Salish | 10.9 /100 | #205 | Poor 17.5% |
| Alaska Natives | 10.4 /100 | #206 | Poor 17.5% |