Hopi vs Immigrants from Singapore Cognitive Disability
COMPARE
Hopi
Immigrants from Singapore
Cognitive Disability
Cognitive Disability Comparison
Hopi
Immigrants from Singapore
17.9%
COGNITIVE DISABILITY
0.6/ 100
METRIC RATING
253rd/ 347
METRIC RANK
17.5%
COGNITIVE DISABILITY
14.3/ 100
METRIC RATING
199th/ 347
METRIC RANK
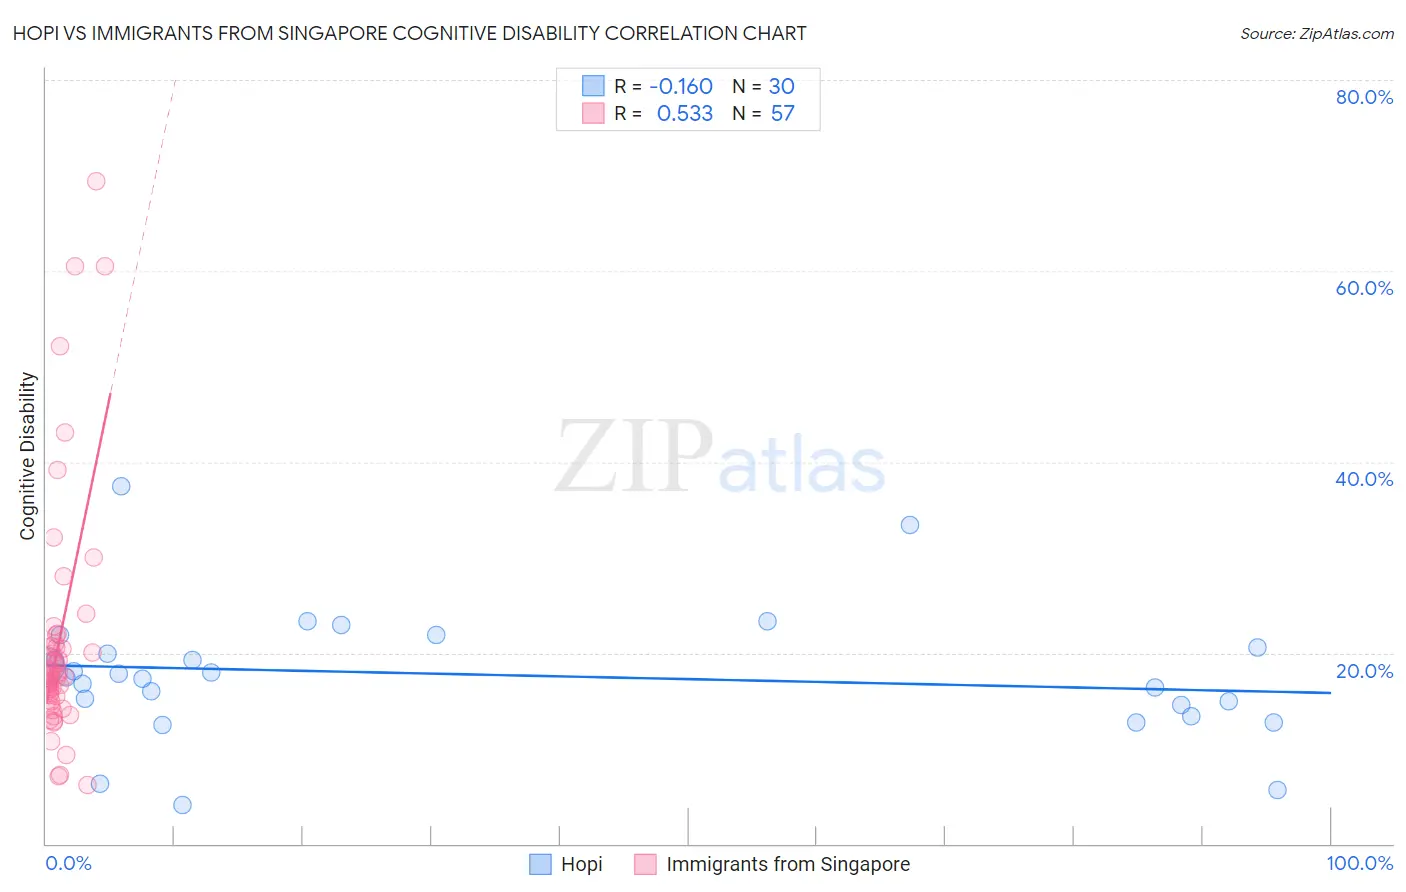
Hopi vs Immigrants from Singapore Cognitive Disability Correlation Chart
The statistical analysis conducted on geographies consisting of 74,733,532 people shows a poor negative correlation between the proportion of Hopi and percentage of population with cognitive disability in the United States with a correlation coefficient (R) of -0.160 and weighted average of 17.9%. Similarly, the statistical analysis conducted on geographies consisting of 137,519,920 people shows a substantial positive correlation between the proportion of Immigrants from Singapore and percentage of population with cognitive disability in the United States with a correlation coefficient (R) of 0.533 and weighted average of 17.5%, a difference of 2.3%.
Cognitive Disability Correlation Summary
| Measurement | Hopi | Immigrants from Singapore |
| Minimum | 4.0% | 6.1% |
| Maximum | 37.5% | 69.3% |
| Range | 33.5% | 63.2% |
| Mean | 17.7% | 21.2% |
| Median | 17.6% | 17.6% |
| Interquartile 25% (IQ1) | 14.6% | 15.2% |
| Interquartile 75% (IQ3) | 20.5% | 20.8% |
| Interquartile Range (IQR) | 6.0% | 5.6% |
| Standard Deviation (Sample) | 6.9% | 12.8% |
| Standard Deviation (Population) | 6.8% | 12.7% |
Similar Demographics by Cognitive Disability
Demographics Similar to Hopi by Cognitive Disability
In terms of cognitive disability, the demographic groups most similar to Hopi are Hispanic or Latino (17.9%, a difference of 0.0%), Immigrants from Grenada (17.9%, a difference of 0.010%), Immigrants from the Azores (17.9%, a difference of 0.010%), Bahamian (17.9%, a difference of 0.010%), and Cree (17.9%, a difference of 0.030%).
| Demographics | Rating | Rank | Cognitive Disability |
| Immigrants | Thailand | 0.8 /100 | #246 | Tragic 17.9% |
| Samoans | 0.7 /100 | #247 | Tragic 17.9% |
| French American Indians | 0.7 /100 | #248 | Tragic 17.9% |
| Cree | 0.7 /100 | #249 | Tragic 17.9% |
| Immigrants | Ethiopia | 0.7 /100 | #250 | Tragic 17.9% |
| Malaysians | 0.6 /100 | #251 | Tragic 17.9% |
| Immigrants | Grenada | 0.6 /100 | #252 | Tragic 17.9% |
| Hopi | 0.6 /100 | #253 | Tragic 17.9% |
| Hispanics or Latinos | 0.6 /100 | #254 | Tragic 17.9% |
| Immigrants | Azores | 0.6 /100 | #255 | Tragic 17.9% |
| Bahamians | 0.6 /100 | #256 | Tragic 17.9% |
| Mexican American Indians | 0.6 /100 | #257 | Tragic 17.9% |
| Immigrants | Armenia | 0.6 /100 | #258 | Tragic 17.9% |
| Ethiopians | 0.5 /100 | #259 | Tragic 17.9% |
| Immigrants | Belize | 0.5 /100 | #260 | Tragic 17.9% |
Demographics Similar to Immigrants from Singapore by Cognitive Disability
In terms of cognitive disability, the demographic groups most similar to Immigrants from Singapore are Haitian (17.5%, a difference of 0.010%), Immigrants from Panama (17.5%, a difference of 0.030%), South American Indian (17.5%, a difference of 0.080%), Immigrants from Afghanistan (17.5%, a difference of 0.13%), and Immigrants from Morocco (17.5%, a difference of 0.14%).
| Demographics | Rating | Rank | Cognitive Disability |
| Immigrants | Haiti | 27.1 /100 | #192 | Fair 17.4% |
| Delaware | 25.6 /100 | #193 | Fair 17.4% |
| Immigrants | Bosnia and Herzegovina | 22.0 /100 | #194 | Fair 17.4% |
| New Zealanders | 21.1 /100 | #195 | Fair 17.4% |
| Guyanese | 17.5 /100 | #196 | Poor 17.5% |
| Immigrants | Afghanistan | 16.7 /100 | #197 | Poor 17.5% |
| Immigrants | Panama | 14.8 /100 | #198 | Poor 17.5% |
| Immigrants | Singapore | 14.3 /100 | #199 | Poor 17.5% |
| Haitians | 14.1 /100 | #200 | Poor 17.5% |
| South American Indians | 13.0 /100 | #201 | Poor 17.5% |
| Immigrants | Morocco | 12.0 /100 | #202 | Poor 17.5% |
| Immigrants | Caribbean | 11.0 /100 | #203 | Poor 17.5% |
| Immigrants | Zimbabwe | 11.0 /100 | #204 | Poor 17.5% |
| Puget Sound Salish | 10.9 /100 | #205 | Poor 17.5% |
| Alaska Natives | 10.4 /100 | #206 | Poor 17.5% |