Inupiat vs Immigrants from Philippines Divorced or Separated
COMPARE
Inupiat
Immigrants from Philippines
Divorced or Separated
Divorced or Separated Comparison
Inupiat
Immigrants from Philippines
11.4%
DIVORCED OR SEPARATED
99.8/ 100
METRIC RATING
66th/ 347
METRIC RANK
11.3%
DIVORCED OR SEPARATED
99.9/ 100
METRIC RATING
56th/ 347
METRIC RANK
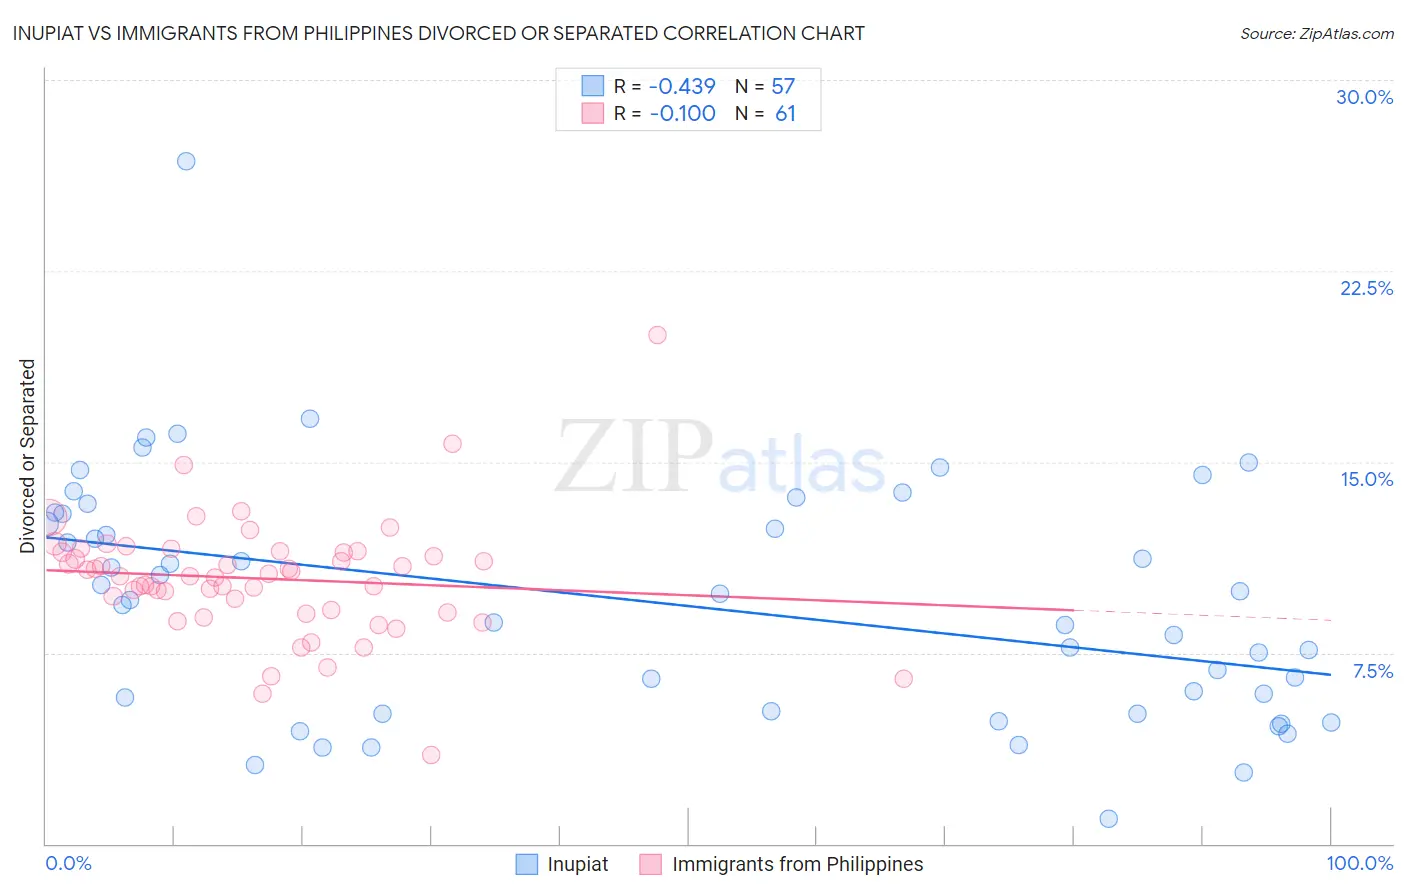
Inupiat vs Immigrants from Philippines Divorced or Separated Correlation Chart
The statistical analysis conducted on geographies consisting of 96,343,887 people shows a moderate negative correlation between the proportion of Inupiat and percentage of population currently divorced or separated in the United States with a correlation coefficient (R) of -0.439 and weighted average of 11.4%. Similarly, the statistical analysis conducted on geographies consisting of 471,142,123 people shows a poor negative correlation between the proportion of Immigrants from Philippines and percentage of population currently divorced or separated in the United States with a correlation coefficient (R) of -0.100 and weighted average of 11.3%, a difference of 1.0%.
Divorced or Separated Correlation Summary
| Measurement | Inupiat | Immigrants from Philippines |
| Minimum | 1.0% | 3.5% |
| Maximum | 26.8% | 20.0% |
| Range | 25.8% | 16.5% |
| Mean | 9.5% | 10.4% |
| Median | 9.6% | 10.5% |
| Interquartile 25% (IQ1) | 5.2% | 9.1% |
| Interquartile 75% (IQ3) | 13.0% | 11.5% |
| Interquartile Range (IQR) | 7.8% | 2.3% |
| Standard Deviation (Sample) | 4.7% | 2.4% |
| Standard Deviation (Population) | 4.7% | 2.4% |
Demographics Similar to Inupiat and Immigrants from Philippines by Divorced or Separated
In terms of divorced or separated, the demographic groups most similar to Inupiat are Immigrants from Syria (11.4%, a difference of 0.090%), Immigrants from South Eastern Asia (11.4%, a difference of 0.14%), Macedonian (11.4%, a difference of 0.18%), Palestinian (11.5%, a difference of 0.20%), and Immigrants from Belgium (11.5%, a difference of 0.21%). Similarly, the demographic groups most similar to Immigrants from Philippines are Immigrants from Vietnam (11.3%, a difference of 0.010%), Eastern European (11.3%, a difference of 0.070%), Immigrants from Yemen (11.3%, a difference of 0.070%), Sri Lankan (11.3%, a difference of 0.070%), and Israeli (11.3%, a difference of 0.17%).
| Demographics | Rating | Rank | Divorced or Separated |
| Immigrants | Bolivia | 100.0 /100 | #51 | Exceptional 11.3% |
| Immigrants | Australia | 99.9 /100 | #52 | Exceptional 11.3% |
| Immigrants | Lithuania | 99.9 /100 | #53 | Exceptional 11.3% |
| Eastern Europeans | 99.9 /100 | #54 | Exceptional 11.3% |
| Immigrants | Yemen | 99.9 /100 | #55 | Exceptional 11.3% |
| Immigrants | Philippines | 99.9 /100 | #56 | Exceptional 11.3% |
| Immigrants | Vietnam | 99.9 /100 | #57 | Exceptional 11.3% |
| Sri Lankans | 99.9 /100 | #58 | Exceptional 11.3% |
| Israelis | 99.9 /100 | #59 | Exceptional 11.3% |
| Immigrants | Russia | 99.9 /100 | #60 | Exceptional 11.3% |
| Koreans | 99.9 /100 | #61 | Exceptional 11.3% |
| Luxembourgers | 99.9 /100 | #62 | Exceptional 11.3% |
| Immigrants | Kuwait | 99.9 /100 | #63 | Exceptional 11.3% |
| Macedonians | 99.8 /100 | #64 | Exceptional 11.4% |
| Immigrants | South Eastern Asia | 99.8 /100 | #65 | Exceptional 11.4% |
| Inupiat | 99.8 /100 | #66 | Exceptional 11.4% |
| Immigrants | Syria | 99.7 /100 | #67 | Exceptional 11.4% |
| Palestinians | 99.7 /100 | #68 | Exceptional 11.5% |
| Immigrants | Belgium | 99.7 /100 | #69 | Exceptional 11.5% |
| Immigrants | Eastern Europe | 99.7 /100 | #70 | Exceptional 11.5% |
| Paraguayans | 99.7 /100 | #71 | Exceptional 11.5% |