Immigrants from Dominica vs Immigrants from Philippines Disability
COMPARE
Immigrants from Dominica
Immigrants from Philippines
Disability
Disability Comparison
Immigrants from Dominica
Immigrants from Philippines
12.4%
DISABILITY
0.6/ 100
METRIC RATING
256th/ 347
METRIC RANK
11.3%
DISABILITY
94.6/ 100
METRIC RATING
115th/ 347
METRIC RANK
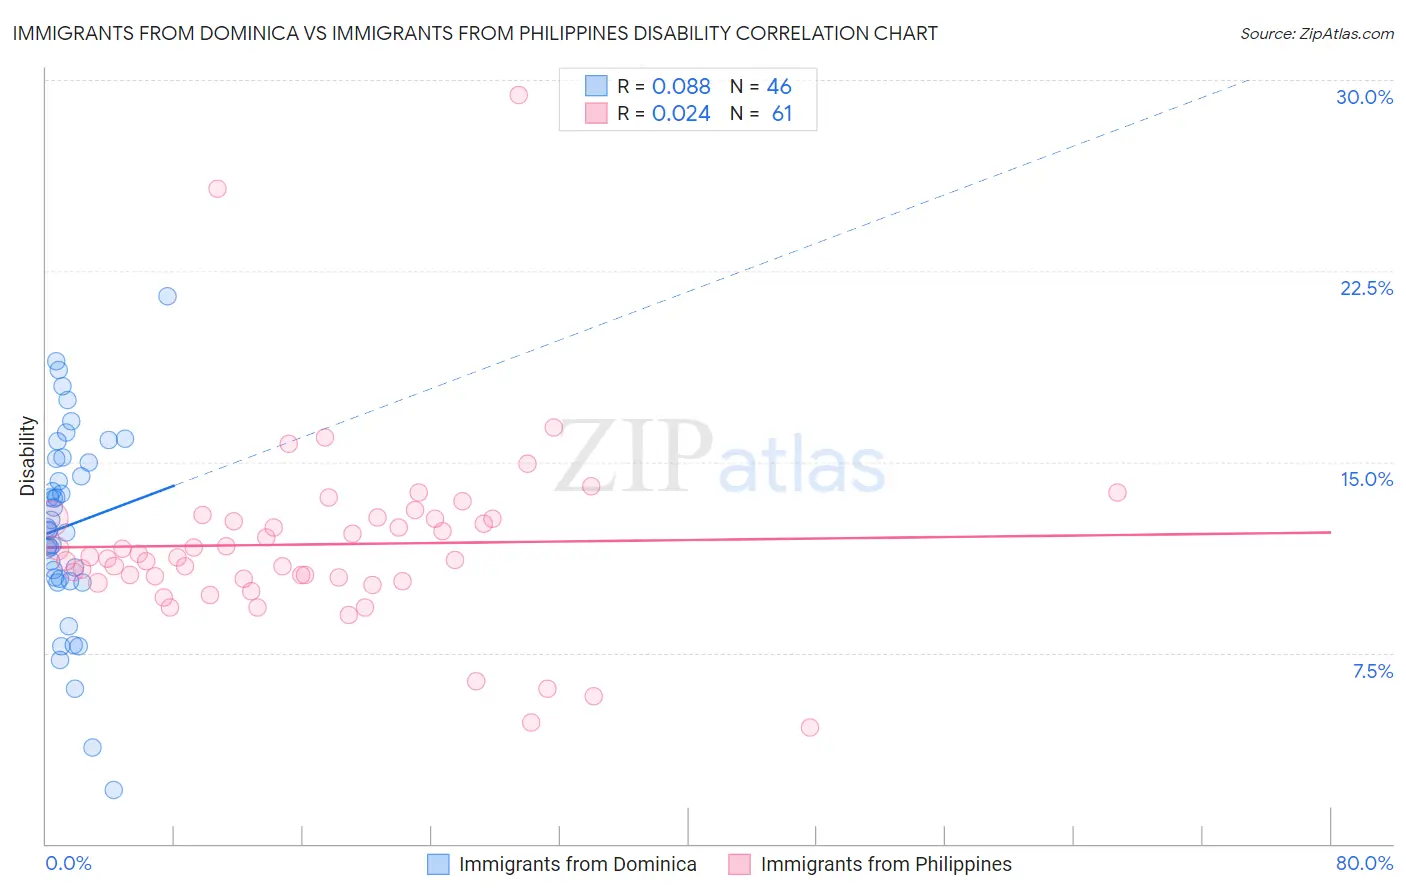
Immigrants from Dominica vs Immigrants from Philippines Disability Correlation Chart
The statistical analysis conducted on geographies consisting of 83,793,635 people shows a slight positive correlation between the proportion of Immigrants from Dominica and percentage of population with a disability in the United States with a correlation coefficient (R) of 0.088 and weighted average of 12.4%. Similarly, the statistical analysis conducted on geographies consisting of 471,195,487 people shows no correlation between the proportion of Immigrants from Philippines and percentage of population with a disability in the United States with a correlation coefficient (R) of 0.024 and weighted average of 11.3%, a difference of 9.2%.
Disability Correlation Summary
| Measurement | Immigrants from Dominica | Immigrants from Philippines |
| Minimum | 2.1% | 4.6% |
| Maximum | 21.5% | 29.4% |
| Range | 19.4% | 24.8% |
| Mean | 12.5% | 11.8% |
| Median | 12.4% | 11.3% |
| Interquartile 25% (IQ1) | 10.4% | 10.4% |
| Interquartile 75% (IQ3) | 15.1% | 12.8% |
| Interquartile Range (IQR) | 4.7% | 2.4% |
| Standard Deviation (Sample) | 3.9% | 3.8% |
| Standard Deviation (Population) | 3.9% | 3.8% |
Similar Demographics by Disability
Demographics Similar to Immigrants from Dominica by Disability
In terms of disability, the demographic groups most similar to Immigrants from Dominica are Slovene (12.4%, a difference of 0.070%), Immigrants from Laos (12.4%, a difference of 0.090%), Slavic (12.4%, a difference of 0.23%), Canadian (12.4%, a difference of 0.29%), and Immigrants from Liberia (12.4%, a difference of 0.32%).
| Demographics | Rating | Rank | Disability |
| Carpatho Rusyns | 1.4 /100 | #249 | Tragic 12.3% |
| Sub-Saharan Africans | 1.4 /100 | #250 | Tragic 12.3% |
| Europeans | 1.4 /100 | #251 | Tragic 12.3% |
| Bermudans | 1.1 /100 | #252 | Tragic 12.3% |
| Belgians | 0.8 /100 | #253 | Tragic 12.3% |
| German Russians | 0.8 /100 | #254 | Tragic 12.3% |
| Slovenes | 0.6 /100 | #255 | Tragic 12.4% |
| Immigrants | Dominica | 0.6 /100 | #256 | Tragic 12.4% |
| Immigrants | Laos | 0.5 /100 | #257 | Tragic 12.4% |
| Slavs | 0.5 /100 | #258 | Tragic 12.4% |
| Canadians | 0.4 /100 | #259 | Tragic 12.4% |
| Immigrants | Liberia | 0.4 /100 | #260 | Tragic 12.4% |
| Scandinavians | 0.4 /100 | #261 | Tragic 12.4% |
| Native Hawaiians | 0.3 /100 | #262 | Tragic 12.5% |
| Hawaiians | 0.2 /100 | #263 | Tragic 12.5% |
Demographics Similar to Immigrants from Philippines by Disability
In terms of disability, the demographic groups most similar to Immigrants from Philippines are Immigrants from Syria (11.3%, a difference of 0.010%), Guyanese (11.3%, a difference of 0.020%), Immigrants from Uzbekistan (11.3%, a difference of 0.060%), Immigrants from Northern Europe (11.3%, a difference of 0.11%), and Luxembourger (11.3%, a difference of 0.17%).
| Demographics | Rating | Rank | Disability |
| Immigrants | Nigeria | 96.0 /100 | #108 | Exceptional 11.3% |
| Immigrants | Uganda | 95.7 /100 | #109 | Exceptional 11.3% |
| Immigrants | Denmark | 95.6 /100 | #110 | Exceptional 11.3% |
| Immigrants | South Eastern Asia | 95.4 /100 | #111 | Exceptional 11.3% |
| Immigrants | Uzbekistan | 94.9 /100 | #112 | Exceptional 11.3% |
| Guyanese | 94.7 /100 | #113 | Exceptional 11.3% |
| Immigrants | Syria | 94.7 /100 | #114 | Exceptional 11.3% |
| Immigrants | Philippines | 94.6 /100 | #115 | Exceptional 11.3% |
| Immigrants | Northern Europe | 94.1 /100 | #116 | Exceptional 11.3% |
| Luxembourgers | 93.9 /100 | #117 | Exceptional 11.3% |
| Koreans | 93.8 /100 | #118 | Exceptional 11.3% |
| Central Americans | 93.5 /100 | #119 | Exceptional 11.4% |
| Immigrants | North Macedonia | 93.5 /100 | #120 | Exceptional 11.4% |
| Immigrants | Costa Rica | 93.4 /100 | #121 | Exceptional 11.4% |
| Brazilians | 93.3 /100 | #122 | Exceptional 11.4% |