Indonesian vs Japanese Vision Disability
COMPARE
Indonesian
Japanese
Vision Disability
Vision Disability Comparison
Indonesians
Japanese
2.2%
VISION DISABILITY
9.5/ 100
METRIC RATING
211th/ 347
METRIC RANK
2.4%
VISION DISABILITY
0.3/ 100
METRIC RATING
253rd/ 347
METRIC RANK
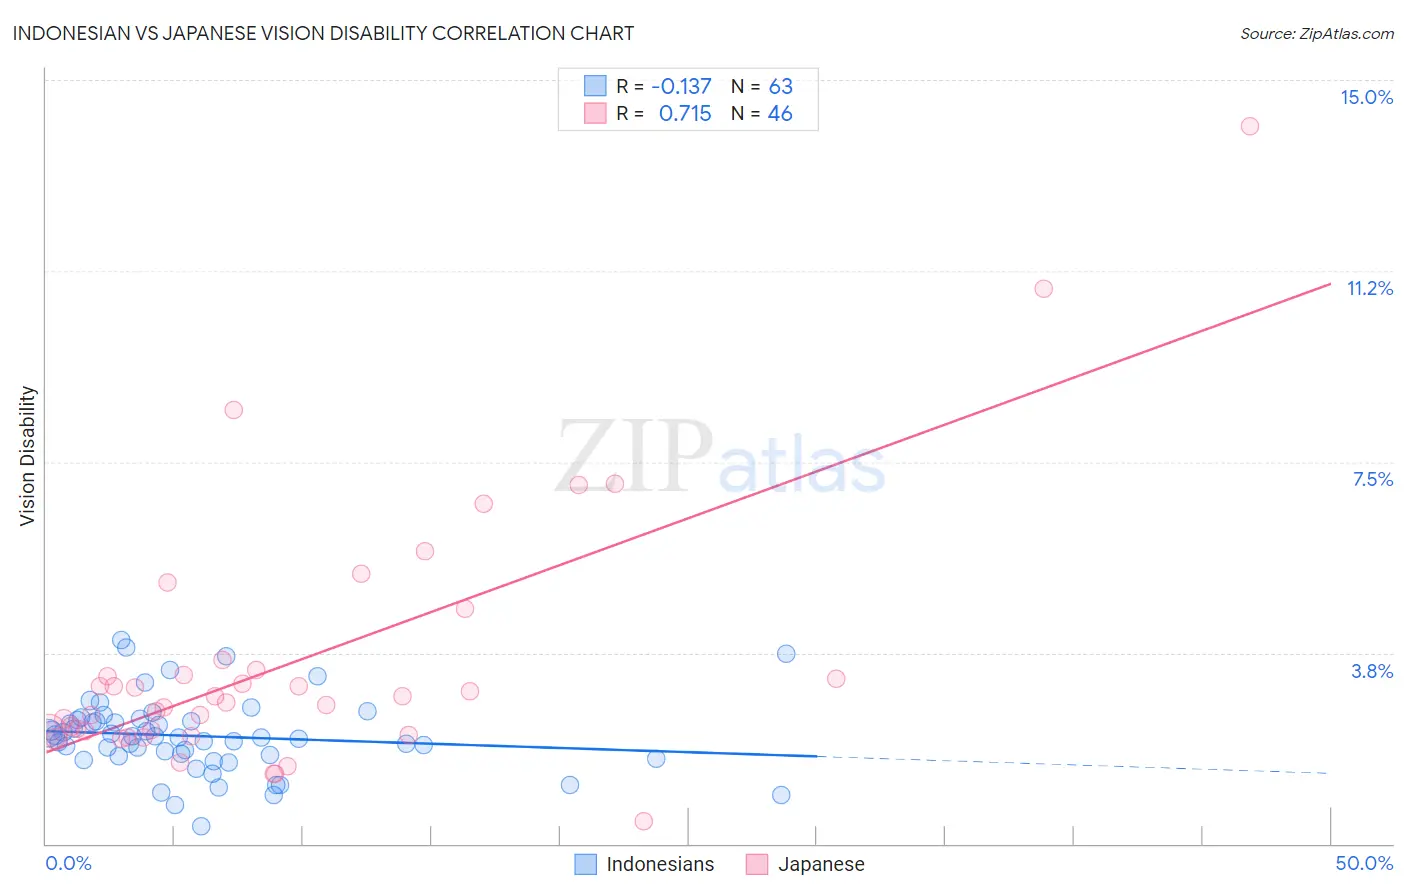
Indonesian vs Japanese Vision Disability Correlation Chart
The statistical analysis conducted on geographies consisting of 162,708,643 people shows a poor negative correlation between the proportion of Indonesians and percentage of population with vision disability in the United States with a correlation coefficient (R) of -0.137 and weighted average of 2.2%. Similarly, the statistical analysis conducted on geographies consisting of 249,077,012 people shows a strong positive correlation between the proportion of Japanese and percentage of population with vision disability in the United States with a correlation coefficient (R) of 0.715 and weighted average of 2.4%, a difference of 5.3%.
Vision Disability Correlation Summary
| Measurement | Indonesian | Japanese |
| Minimum | 0.34% | 0.43% |
| Maximum | 4.0% | 14.1% |
| Range | 3.7% | 13.7% |
| Mean | 2.1% | 3.6% |
| Median | 2.1% | 2.8% |
| Interquartile 25% (IQ1) | 1.7% | 2.2% |
| Interquartile 75% (IQ3) | 2.4% | 3.4% |
| Interquartile Range (IQR) | 0.71% | 1.2% |
| Standard Deviation (Sample) | 0.74% | 2.6% |
| Standard Deviation (Population) | 0.73% | 2.5% |
Similar Demographics by Vision Disability
Demographics Similar to Indonesians by Vision Disability
In terms of vision disability, the demographic groups most similar to Indonesians are Bermudan (2.2%, a difference of 0.090%), Immigrants from Ghana (2.2%, a difference of 0.10%), Trinidadian and Tobagonian (2.2%, a difference of 0.23%), Immigrants from Uruguay (2.2%, a difference of 0.34%), and Nigerian (2.3%, a difference of 0.44%).
| Demographics | Rating | Rank | Vision Disability |
| Immigrants | Guyana | 15.9 /100 | #204 | Poor 2.2% |
| Samoans | 15.7 /100 | #205 | Poor 2.2% |
| Pennsylvania Germans | 14.5 /100 | #206 | Poor 2.2% |
| Immigrants | Nigeria | 13.5 /100 | #207 | Poor 2.2% |
| Germans | 13.4 /100 | #208 | Poor 2.2% |
| Immigrants | Brazil | 13.1 /100 | #209 | Poor 2.2% |
| Immigrants | Uruguay | 11.5 /100 | #210 | Poor 2.2% |
| Indonesians | 9.5 /100 | #211 | Tragic 2.2% |
| Bermudans | 9.0 /100 | #212 | Tragic 2.2% |
| Immigrants | Ghana | 8.9 /100 | #213 | Tragic 2.2% |
| Trinidadians and Tobagonians | 8.2 /100 | #214 | Tragic 2.2% |
| Nigerians | 7.2 /100 | #215 | Tragic 2.3% |
| Immigrants | Trinidad and Tobago | 6.1 /100 | #216 | Tragic 2.3% |
| Barbadians | 5.1 /100 | #217 | Tragic 2.3% |
| Portuguese | 4.9 /100 | #218 | Tragic 2.3% |
Demographics Similar to Japanese by Vision Disability
In terms of vision disability, the demographic groups most similar to Japanese are Immigrants from Micronesia (2.4%, a difference of 0.070%), Haitian (2.4%, a difference of 0.28%), Immigrants from Guatemala (2.4%, a difference of 0.31%), Immigrants from Laos (2.4%, a difference of 0.39%), and Bangladeshi (2.3%, a difference of 0.50%).
| Demographics | Rating | Rank | Vision Disability |
| French | 0.5 /100 | #246 | Tragic 2.3% |
| Guatemalans | 0.5 /100 | #247 | Tragic 2.3% |
| Sub-Saharan Africans | 0.5 /100 | #248 | Tragic 2.3% |
| Liberians | 0.5 /100 | #249 | Tragic 2.3% |
| Bangladeshis | 0.5 /100 | #250 | Tragic 2.3% |
| Immigrants | Laos | 0.4 /100 | #251 | Tragic 2.4% |
| Immigrants | Micronesia | 0.3 /100 | #252 | Tragic 2.4% |
| Japanese | 0.3 /100 | #253 | Tragic 2.4% |
| Haitians | 0.3 /100 | #254 | Tragic 2.4% |
| Immigrants | Guatemala | 0.3 /100 | #255 | Tragic 2.4% |
| Immigrants | Haiti | 0.2 /100 | #256 | Tragic 2.4% |
| West Indians | 0.2 /100 | #257 | Tragic 2.4% |
| British West Indians | 0.2 /100 | #258 | Tragic 2.4% |
| Whites/Caucasians | 0.2 /100 | #259 | Tragic 2.4% |
| Belizeans | 0.2 /100 | #260 | Tragic 2.4% |