Spaniard vs Japanese Vision Disability
COMPARE
Spaniard
Japanese
Vision Disability
Vision Disability Comparison
Spaniards
Japanese
2.4%
VISION DISABILITY
0.1/ 100
METRIC RATING
272nd/ 347
METRIC RANK
2.4%
VISION DISABILITY
0.3/ 100
METRIC RATING
253rd/ 347
METRIC RANK
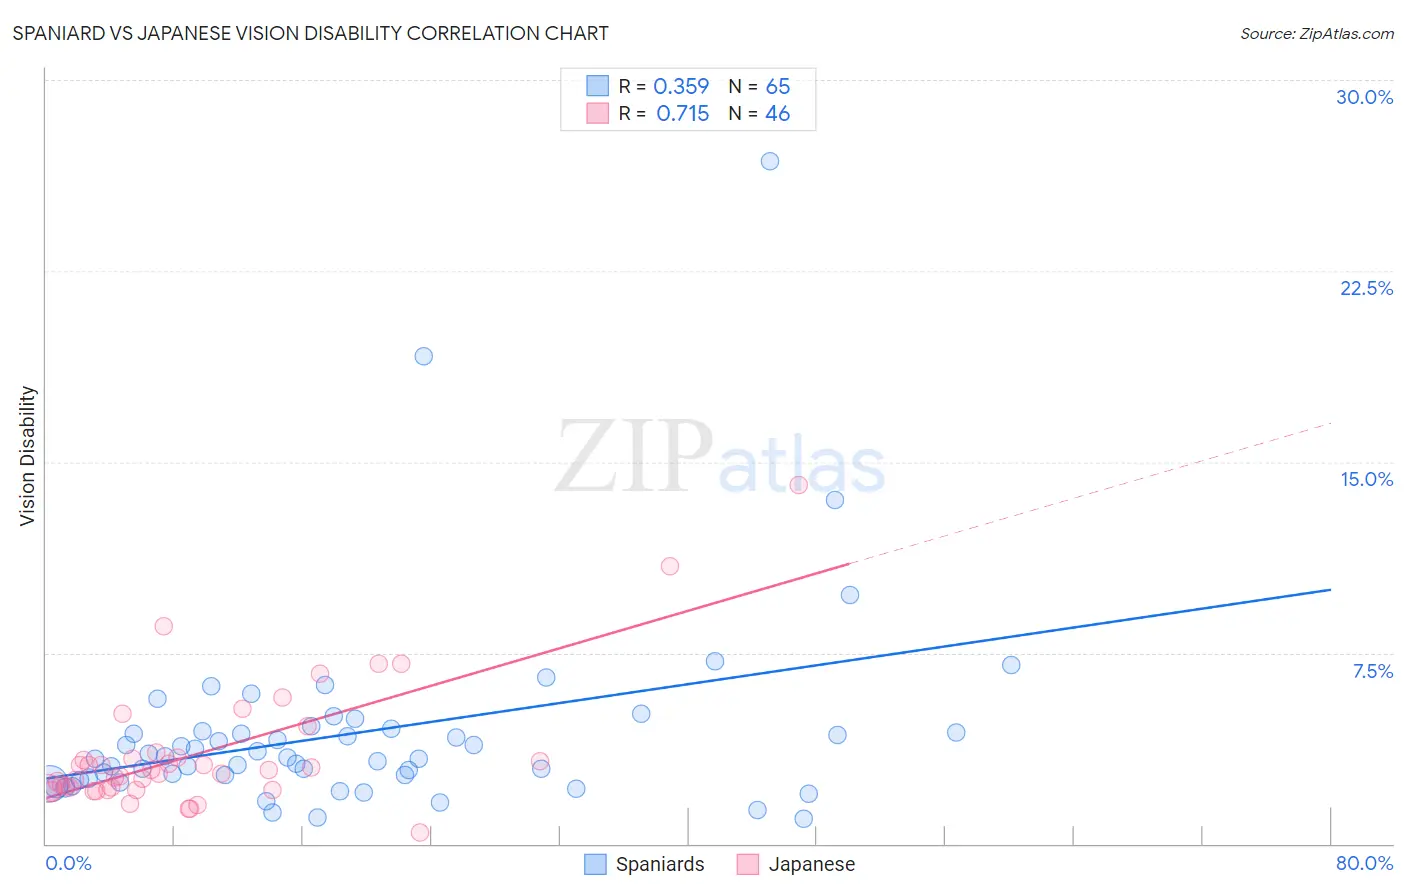
Spaniard vs Japanese Vision Disability Correlation Chart
The statistical analysis conducted on geographies consisting of 443,022,982 people shows a mild positive correlation between the proportion of Spaniards and percentage of population with vision disability in the United States with a correlation coefficient (R) of 0.359 and weighted average of 2.4%. Similarly, the statistical analysis conducted on geographies consisting of 249,077,012 people shows a strong positive correlation between the proportion of Japanese and percentage of population with vision disability in the United States with a correlation coefficient (R) of 0.715 and weighted average of 2.4%, a difference of 2.3%.
Vision Disability Correlation Summary
| Measurement | Spaniard | Japanese |
| Minimum | 0.97% | 0.43% |
| Maximum | 26.8% | 14.1% |
| Range | 25.9% | 13.7% |
| Mean | 4.4% | 3.6% |
| Median | 3.4% | 2.8% |
| Interquartile 25% (IQ1) | 2.5% | 2.2% |
| Interquartile 75% (IQ3) | 4.4% | 3.4% |
| Interquartile Range (IQR) | 1.9% | 1.2% |
| Standard Deviation (Sample) | 4.0% | 2.6% |
| Standard Deviation (Population) | 3.9% | 2.5% |
Demographics Similar to Spaniards and Japanese by Vision Disability
In terms of vision disability, the demographic groups most similar to Spaniards are Immigrants from the Azores (2.4%, a difference of 0.10%), Cuban (2.4%, a difference of 0.26%), Celtic (2.4%, a difference of 0.27%), Senegalese (2.4%, a difference of 0.54%), and Ute (2.4%, a difference of 0.63%). Similarly, the demographic groups most similar to Japanese are Immigrants from Micronesia (2.4%, a difference of 0.070%), Haitian (2.4%, a difference of 0.28%), Immigrants from Guatemala (2.4%, a difference of 0.31%), Immigrants from Haiti (2.4%, a difference of 0.63%), and West Indian (2.4%, a difference of 0.71%).
| Demographics | Rating | Rank | Vision Disability |
| Immigrants | Micronesia | 0.3 /100 | #252 | Tragic 2.4% |
| Japanese | 0.3 /100 | #253 | Tragic 2.4% |
| Haitians | 0.3 /100 | #254 | Tragic 2.4% |
| Immigrants | Guatemala | 0.3 /100 | #255 | Tragic 2.4% |
| Immigrants | Haiti | 0.2 /100 | #256 | Tragic 2.4% |
| West Indians | 0.2 /100 | #257 | Tragic 2.4% |
| British West Indians | 0.2 /100 | #258 | Tragic 2.4% |
| Whites/Caucasians | 0.2 /100 | #259 | Tragic 2.4% |
| Belizeans | 0.2 /100 | #260 | Tragic 2.4% |
| Fijians | 0.1 /100 | #261 | Tragic 2.4% |
| Jamaicans | 0.1 /100 | #262 | Tragic 2.4% |
| Immigrants | Belize | 0.1 /100 | #263 | Tragic 2.4% |
| Immigrants | Liberia | 0.1 /100 | #264 | Tragic 2.4% |
| Immigrants | Jamaica | 0.1 /100 | #265 | Tragic 2.4% |
| Mexican American Indians | 0.1 /100 | #266 | Tragic 2.4% |
| Ute | 0.1 /100 | #267 | Tragic 2.4% |
| Senegalese | 0.1 /100 | #268 | Tragic 2.4% |
| Celtics | 0.1 /100 | #269 | Tragic 2.4% |
| Cubans | 0.1 /100 | #270 | Tragic 2.4% |
| Immigrants | Azores | 0.1 /100 | #271 | Tragic 2.4% |
| Spaniards | 0.1 /100 | #272 | Tragic 2.4% |