Egyptian vs Japanese Vision Disability
COMPARE
Egyptian
Japanese
Vision Disability
Vision Disability Comparison
Egyptians
Japanese
1.9%
VISION DISABILITY
99.9/ 100
METRIC RATING
29th/ 347
METRIC RANK
2.4%
VISION DISABILITY
0.3/ 100
METRIC RATING
253rd/ 347
METRIC RANK
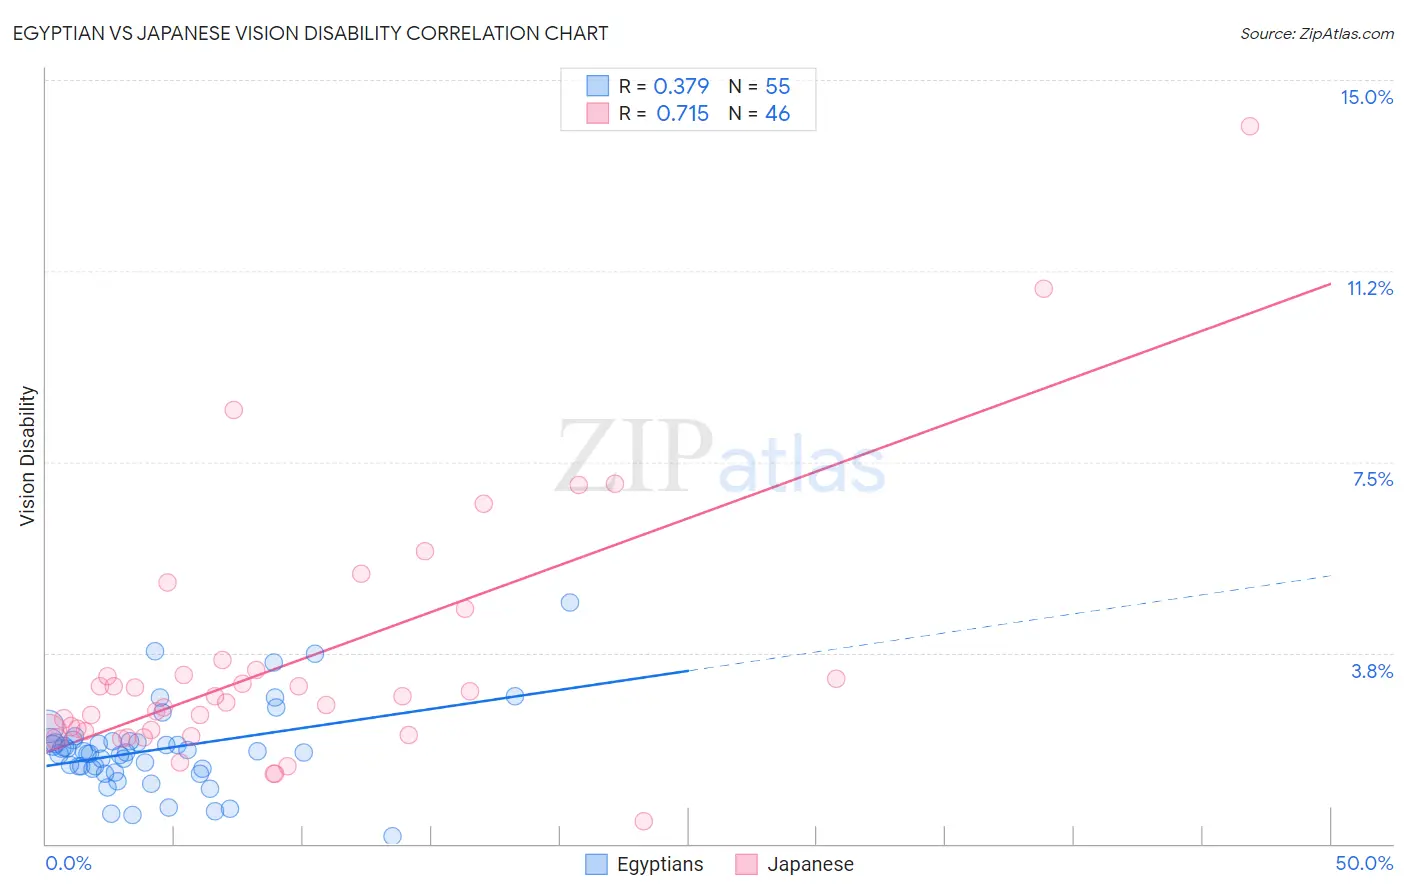
Egyptian vs Japanese Vision Disability Correlation Chart
The statistical analysis conducted on geographies consisting of 276,791,971 people shows a mild positive correlation between the proportion of Egyptians and percentage of population with vision disability in the United States with a correlation coefficient (R) of 0.379 and weighted average of 1.9%. Similarly, the statistical analysis conducted on geographies consisting of 249,077,012 people shows a strong positive correlation between the proportion of Japanese and percentage of population with vision disability in the United States with a correlation coefficient (R) of 0.715 and weighted average of 2.4%, a difference of 22.4%.
Vision Disability Correlation Summary
| Measurement | Egyptian | Japanese |
| Minimum | 0.14% | 0.43% |
| Maximum | 4.7% | 14.1% |
| Range | 4.6% | 13.7% |
| Mean | 1.9% | 3.6% |
| Median | 1.8% | 2.8% |
| Interquartile 25% (IQ1) | 1.5% | 2.2% |
| Interquartile 75% (IQ3) | 2.0% | 3.4% |
| Interquartile Range (IQR) | 0.54% | 1.2% |
| Standard Deviation (Sample) | 0.83% | 2.6% |
| Standard Deviation (Population) | 0.82% | 2.5% |
Similar Demographics by Vision Disability
Demographics Similar to Egyptians by Vision Disability
In terms of vision disability, the demographic groups most similar to Egyptians are Immigrants from Nepal (1.9%, a difference of 0.040%), Immigrants from Malaysia (1.9%, a difference of 0.070%), Taiwanese (1.9%, a difference of 0.090%), Mongolian (1.9%, a difference of 0.20%), and Immigrants from Japan (1.9%, a difference of 0.43%).
| Demographics | Rating | Rank | Vision Disability |
| Immigrants | Pakistan | 100.0 /100 | #22 | Exceptional 1.9% |
| Immigrants | Asia | 99.9 /100 | #23 | Exceptional 1.9% |
| Immigrants | Lithuania | 99.9 /100 | #24 | Exceptional 1.9% |
| Bulgarians | 99.9 /100 | #25 | Exceptional 1.9% |
| Immigrants | Japan | 99.9 /100 | #26 | Exceptional 1.9% |
| Taiwanese | 99.9 /100 | #27 | Exceptional 1.9% |
| Immigrants | Malaysia | 99.9 /100 | #28 | Exceptional 1.9% |
| Egyptians | 99.9 /100 | #29 | Exceptional 1.9% |
| Immigrants | Nepal | 99.9 /100 | #30 | Exceptional 1.9% |
| Mongolians | 99.9 /100 | #31 | Exceptional 1.9% |
| Luxembourgers | 99.9 /100 | #32 | Exceptional 1.9% |
| Immigrants | Egypt | 99.9 /100 | #33 | Exceptional 1.9% |
| Immigrants | Turkey | 99.8 /100 | #34 | Exceptional 1.9% |
| Immigrants | Australia | 99.8 /100 | #35 | Exceptional 1.9% |
| Cambodians | 99.8 /100 | #36 | Exceptional 2.0% |
Demographics Similar to Japanese by Vision Disability
In terms of vision disability, the demographic groups most similar to Japanese are Immigrants from Micronesia (2.4%, a difference of 0.070%), Haitian (2.4%, a difference of 0.28%), Immigrants from Guatemala (2.4%, a difference of 0.31%), Immigrants from Laos (2.4%, a difference of 0.39%), and Bangladeshi (2.3%, a difference of 0.50%).
| Demographics | Rating | Rank | Vision Disability |
| French | 0.5 /100 | #246 | Tragic 2.3% |
| Guatemalans | 0.5 /100 | #247 | Tragic 2.3% |
| Sub-Saharan Africans | 0.5 /100 | #248 | Tragic 2.3% |
| Liberians | 0.5 /100 | #249 | Tragic 2.3% |
| Bangladeshis | 0.5 /100 | #250 | Tragic 2.3% |
| Immigrants | Laos | 0.4 /100 | #251 | Tragic 2.4% |
| Immigrants | Micronesia | 0.3 /100 | #252 | Tragic 2.4% |
| Japanese | 0.3 /100 | #253 | Tragic 2.4% |
| Haitians | 0.3 /100 | #254 | Tragic 2.4% |
| Immigrants | Guatemala | 0.3 /100 | #255 | Tragic 2.4% |
| Immigrants | Haiti | 0.2 /100 | #256 | Tragic 2.4% |
| West Indians | 0.2 /100 | #257 | Tragic 2.4% |
| British West Indians | 0.2 /100 | #258 | Tragic 2.4% |
| Whites/Caucasians | 0.2 /100 | #259 | Tragic 2.4% |
| Belizeans | 0.2 /100 | #260 | Tragic 2.4% |