Indonesian vs Finnish Vision Disability
COMPARE
Indonesian
Finnish
Vision Disability
Vision Disability Comparison
Indonesians
Finns
2.2%
VISION DISABILITY
9.5/ 100
METRIC RATING
211th/ 347
METRIC RANK
2.1%
VISION DISABILITY
78.3/ 100
METRIC RATING
148th/ 347
METRIC RANK
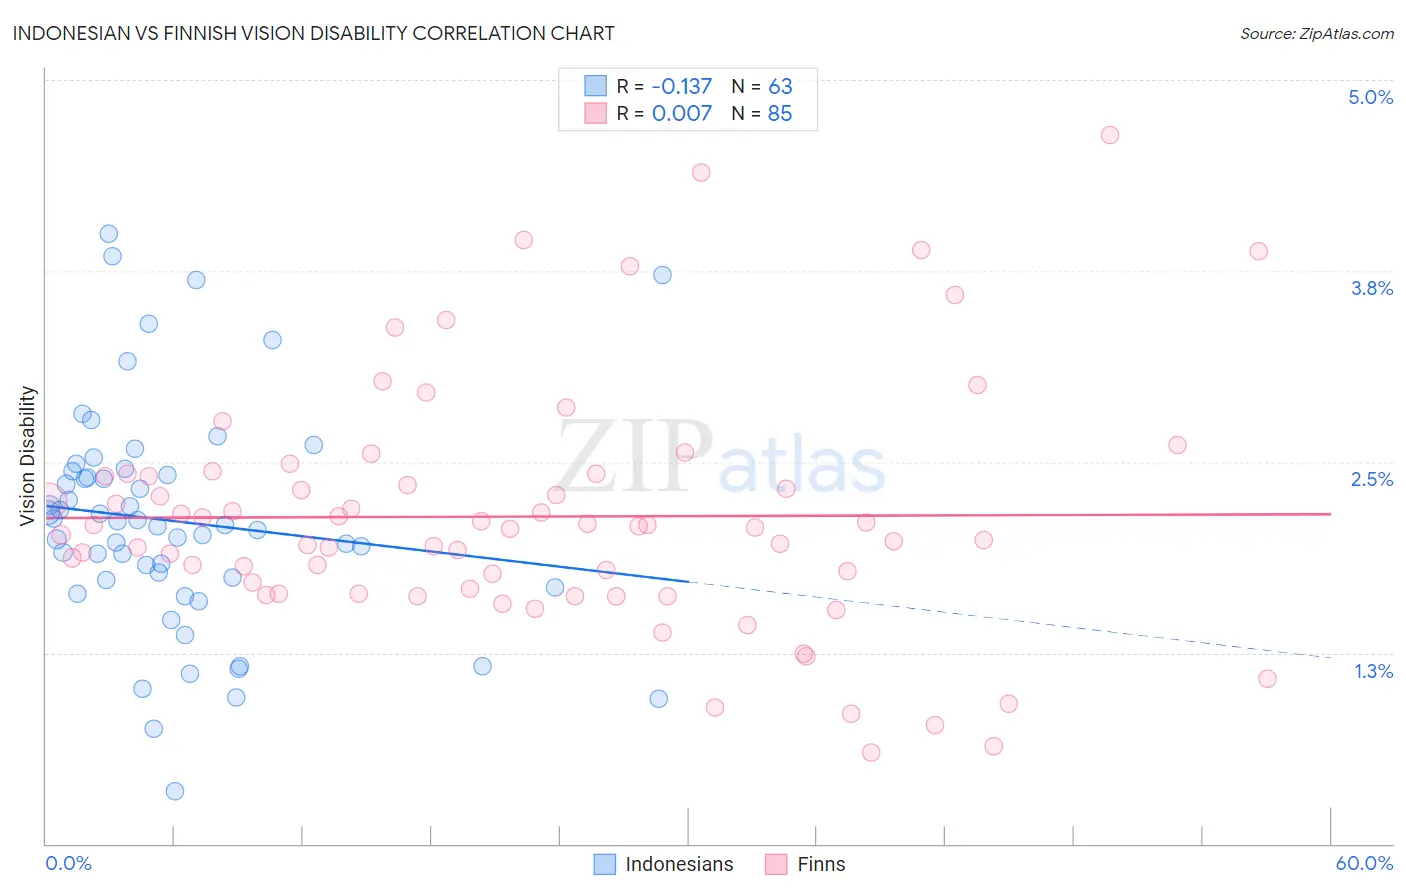
Indonesian vs Finnish Vision Disability Correlation Chart
The statistical analysis conducted on geographies consisting of 162,708,643 people shows a poor negative correlation between the proportion of Indonesians and percentage of population with vision disability in the United States with a correlation coefficient (R) of -0.137 and weighted average of 2.2%. Similarly, the statistical analysis conducted on geographies consisting of 404,250,677 people shows no correlation between the proportion of Finns and percentage of population with vision disability in the United States with a correlation coefficient (R) of 0.007 and weighted average of 2.1%, a difference of 5.7%.
Vision Disability Correlation Summary
| Measurement | Indonesian | Finnish |
| Minimum | 0.34% | 0.59% |
| Maximum | 4.0% | 4.6% |
| Range | 3.7% | 4.0% |
| Mean | 2.1% | 2.1% |
| Median | 2.1% | 2.1% |
| Interquartile 25% (IQ1) | 1.7% | 1.7% |
| Interquartile 75% (IQ3) | 2.4% | 2.4% |
| Interquartile Range (IQR) | 0.71% | 0.76% |
| Standard Deviation (Sample) | 0.74% | 0.79% |
| Standard Deviation (Population) | 0.73% | 0.79% |
Similar Demographics by Vision Disability
Demographics Similar to Indonesians by Vision Disability
In terms of vision disability, the demographic groups most similar to Indonesians are Bermudan (2.2%, a difference of 0.090%), Immigrants from Ghana (2.2%, a difference of 0.10%), Trinidadian and Tobagonian (2.2%, a difference of 0.23%), Immigrants from Uruguay (2.2%, a difference of 0.34%), and Nigerian (2.3%, a difference of 0.44%).
| Demographics | Rating | Rank | Vision Disability |
| Immigrants | Guyana | 15.9 /100 | #204 | Poor 2.2% |
| Samoans | 15.7 /100 | #205 | Poor 2.2% |
| Pennsylvania Germans | 14.5 /100 | #206 | Poor 2.2% |
| Immigrants | Nigeria | 13.5 /100 | #207 | Poor 2.2% |
| Germans | 13.4 /100 | #208 | Poor 2.2% |
| Immigrants | Brazil | 13.1 /100 | #209 | Poor 2.2% |
| Immigrants | Uruguay | 11.5 /100 | #210 | Poor 2.2% |
| Indonesians | 9.5 /100 | #211 | Tragic 2.2% |
| Bermudans | 9.0 /100 | #212 | Tragic 2.2% |
| Immigrants | Ghana | 8.9 /100 | #213 | Tragic 2.2% |
| Trinidadians and Tobagonians | 8.2 /100 | #214 | Tragic 2.2% |
| Nigerians | 7.2 /100 | #215 | Tragic 2.3% |
| Immigrants | Trinidad and Tobago | 6.1 /100 | #216 | Tragic 2.3% |
| Barbadians | 5.1 /100 | #217 | Tragic 2.3% |
| Portuguese | 4.9 /100 | #218 | Tragic 2.3% |
Demographics Similar to Finns by Vision Disability
In terms of vision disability, the demographic groups most similar to Finns are Immigrants from Sudan (2.1%, a difference of 0.010%), Italian (2.1%, a difference of 0.14%), Colombian (2.1%, a difference of 0.19%), Belgian (2.1%, a difference of 0.22%), and Immigrants from Norway (2.1%, a difference of 0.25%).
| Demographics | Rating | Rank | Vision Disability |
| Sierra Leoneans | 84.1 /100 | #141 | Excellent 2.1% |
| South Americans | 82.8 /100 | #142 | Excellent 2.1% |
| Immigrants | Sierra Leone | 82.8 /100 | #143 | Excellent 2.1% |
| Ukrainians | 81.9 /100 | #144 | Excellent 2.1% |
| Immigrants | Bosnia and Herzegovina | 81.5 /100 | #145 | Excellent 2.1% |
| Italians | 79.7 /100 | #146 | Good 2.1% |
| Immigrants | Sudan | 78.4 /100 | #147 | Good 2.1% |
| Finns | 78.3 /100 | #148 | Good 2.1% |
| Colombians | 76.2 /100 | #149 | Good 2.1% |
| Belgians | 75.9 /100 | #150 | Good 2.1% |
| Immigrants | Norway | 75.5 /100 | #151 | Good 2.1% |
| Immigrants | Southern Europe | 74.6 /100 | #152 | Good 2.1% |
| Immigrants | South America | 73.8 /100 | #153 | Good 2.1% |
| Slovenes | 73.6 /100 | #154 | Good 2.1% |
| Immigrants | Colombia | 72.1 /100 | #155 | Good 2.1% |