Indonesian vs Immigrants from Yemen Vision Disability
COMPARE
Indonesian
Immigrants from Yemen
Vision Disability
Vision Disability Comparison
Indonesians
Immigrants from Yemen
2.2%
VISION DISABILITY
9.5/ 100
METRIC RATING
211th/ 347
METRIC RANK
2.6%
VISION DISABILITY
0.0/ 100
METRIC RATING
309th/ 347
METRIC RANK
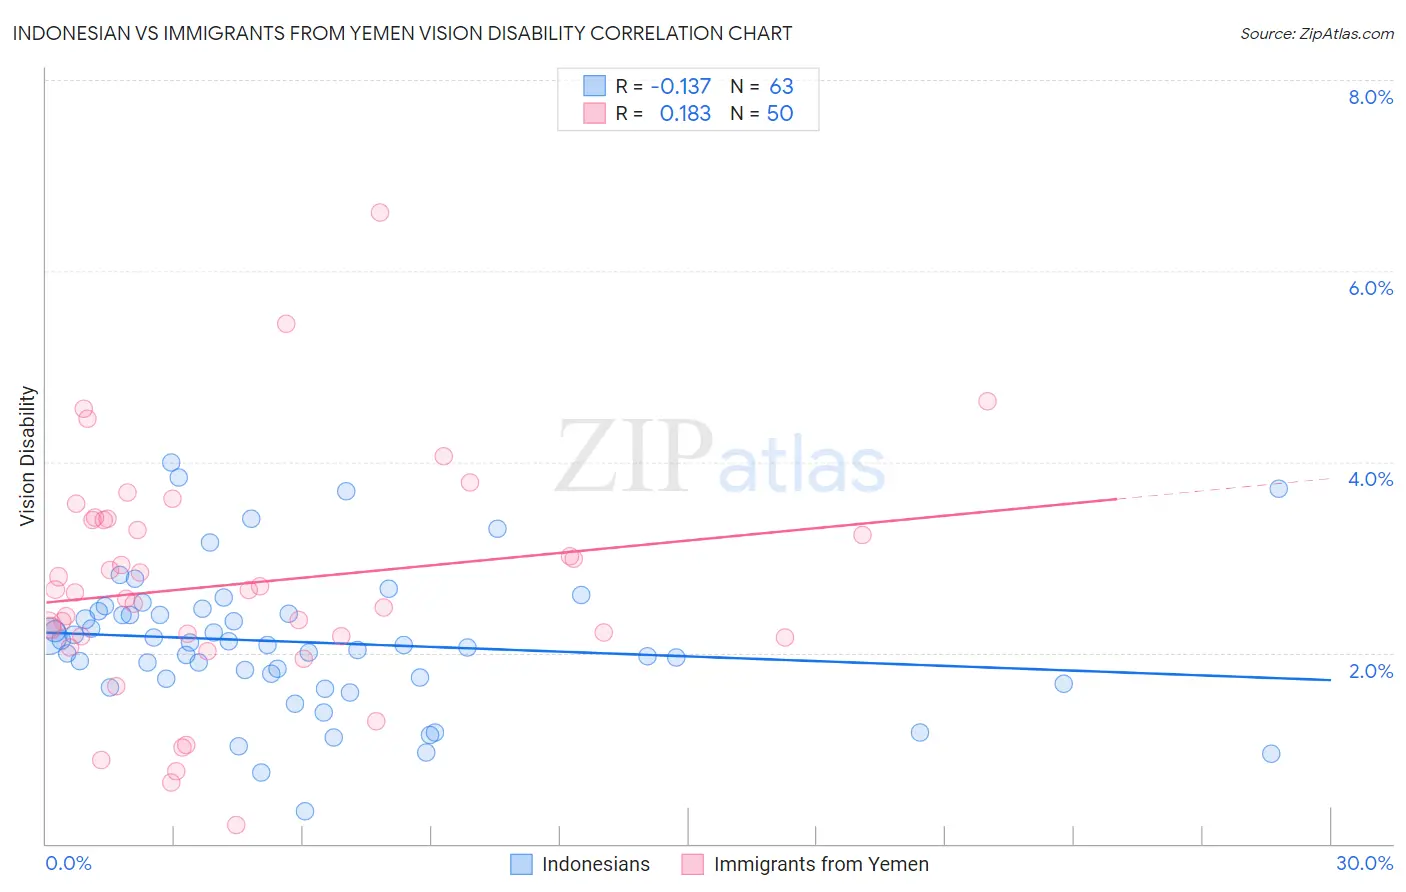
Indonesian vs Immigrants from Yemen Vision Disability Correlation Chart
The statistical analysis conducted on geographies consisting of 162,708,643 people shows a poor negative correlation between the proportion of Indonesians and percentage of population with vision disability in the United States with a correlation coefficient (R) of -0.137 and weighted average of 2.2%. Similarly, the statistical analysis conducted on geographies consisting of 82,432,015 people shows a poor positive correlation between the proportion of Immigrants from Yemen and percentage of population with vision disability in the United States with a correlation coefficient (R) of 0.183 and weighted average of 2.6%, a difference of 16.7%.
Vision Disability Correlation Summary
| Measurement | Indonesian | Immigrants from Yemen |
| Minimum | 0.34% | 0.20% |
| Maximum | 4.0% | 6.6% |
| Range | 3.7% | 6.4% |
| Mean | 2.1% | 2.7% |
| Median | 2.1% | 2.6% |
| Interquartile 25% (IQ1) | 1.7% | 2.2% |
| Interquartile 75% (IQ3) | 2.4% | 3.4% |
| Interquartile Range (IQR) | 0.71% | 1.2% |
| Standard Deviation (Sample) | 0.74% | 1.2% |
| Standard Deviation (Population) | 0.73% | 1.2% |
Similar Demographics by Vision Disability
Demographics Similar to Indonesians by Vision Disability
In terms of vision disability, the demographic groups most similar to Indonesians are Bermudan (2.2%, a difference of 0.090%), Immigrants from Ghana (2.2%, a difference of 0.10%), Trinidadian and Tobagonian (2.2%, a difference of 0.23%), Immigrants from Uruguay (2.2%, a difference of 0.34%), and Nigerian (2.3%, a difference of 0.44%).
| Demographics | Rating | Rank | Vision Disability |
| Immigrants | Guyana | 15.9 /100 | #204 | Poor 2.2% |
| Samoans | 15.7 /100 | #205 | Poor 2.2% |
| Pennsylvania Germans | 14.5 /100 | #206 | Poor 2.2% |
| Immigrants | Nigeria | 13.5 /100 | #207 | Poor 2.2% |
| Germans | 13.4 /100 | #208 | Poor 2.2% |
| Immigrants | Brazil | 13.1 /100 | #209 | Poor 2.2% |
| Immigrants | Uruguay | 11.5 /100 | #210 | Poor 2.2% |
| Indonesians | 9.5 /100 | #211 | Tragic 2.2% |
| Bermudans | 9.0 /100 | #212 | Tragic 2.2% |
| Immigrants | Ghana | 8.9 /100 | #213 | Tragic 2.2% |
| Trinidadians and Tobagonians | 8.2 /100 | #214 | Tragic 2.2% |
| Nigerians | 7.2 /100 | #215 | Tragic 2.3% |
| Immigrants | Trinidad and Tobago | 6.1 /100 | #216 | Tragic 2.3% |
| Barbadians | 5.1 /100 | #217 | Tragic 2.3% |
| Portuguese | 4.9 /100 | #218 | Tragic 2.3% |
Demographics Similar to Immigrants from Yemen by Vision Disability
In terms of vision disability, the demographic groups most similar to Immigrants from Yemen are Arapaho (2.6%, a difference of 0.29%), Immigrants from Dominican Republic (2.6%, a difference of 0.30%), Blackfeet (2.6%, a difference of 0.32%), Iroquois (2.6%, a difference of 0.33%), and Dominican (2.6%, a difference of 0.37%).
| Demographics | Rating | Rank | Vision Disability |
| Spanish American Indians | 0.0 /100 | #302 | Tragic 2.6% |
| Immigrants | Cabo Verde | 0.0 /100 | #303 | Tragic 2.6% |
| Aleuts | 0.0 /100 | #304 | Tragic 2.6% |
| Hispanics or Latinos | 0.0 /100 | #305 | Tragic 2.6% |
| Iroquois | 0.0 /100 | #306 | Tragic 2.6% |
| Immigrants | Dominican Republic | 0.0 /100 | #307 | Tragic 2.6% |
| Arapaho | 0.0 /100 | #308 | Tragic 2.6% |
| Immigrants | Yemen | 0.0 /100 | #309 | Tragic 2.6% |
| Blackfeet | 0.0 /100 | #310 | Tragic 2.6% |
| Dominicans | 0.0 /100 | #311 | Tragic 2.6% |
| Americans | 0.0 /100 | #312 | Tragic 2.6% |
| Potawatomi | 0.0 /100 | #313 | Tragic 2.6% |
| Inupiat | 0.0 /100 | #314 | Tragic 2.7% |
| Osage | 0.0 /100 | #315 | Tragic 2.7% |
| Shoshone | 0.0 /100 | #316 | Tragic 2.7% |