Indonesian vs Immigrants from Taiwan Vision Disability
COMPARE
Indonesian
Immigrants from Taiwan
Vision Disability
Vision Disability Comparison
Indonesians
Immigrants from Taiwan
2.2%
VISION DISABILITY
9.5/ 100
METRIC RATING
211th/ 347
METRIC RANK
1.7%
VISION DISABILITY
100.0/ 100
METRIC RATING
3rd/ 347
METRIC RANK
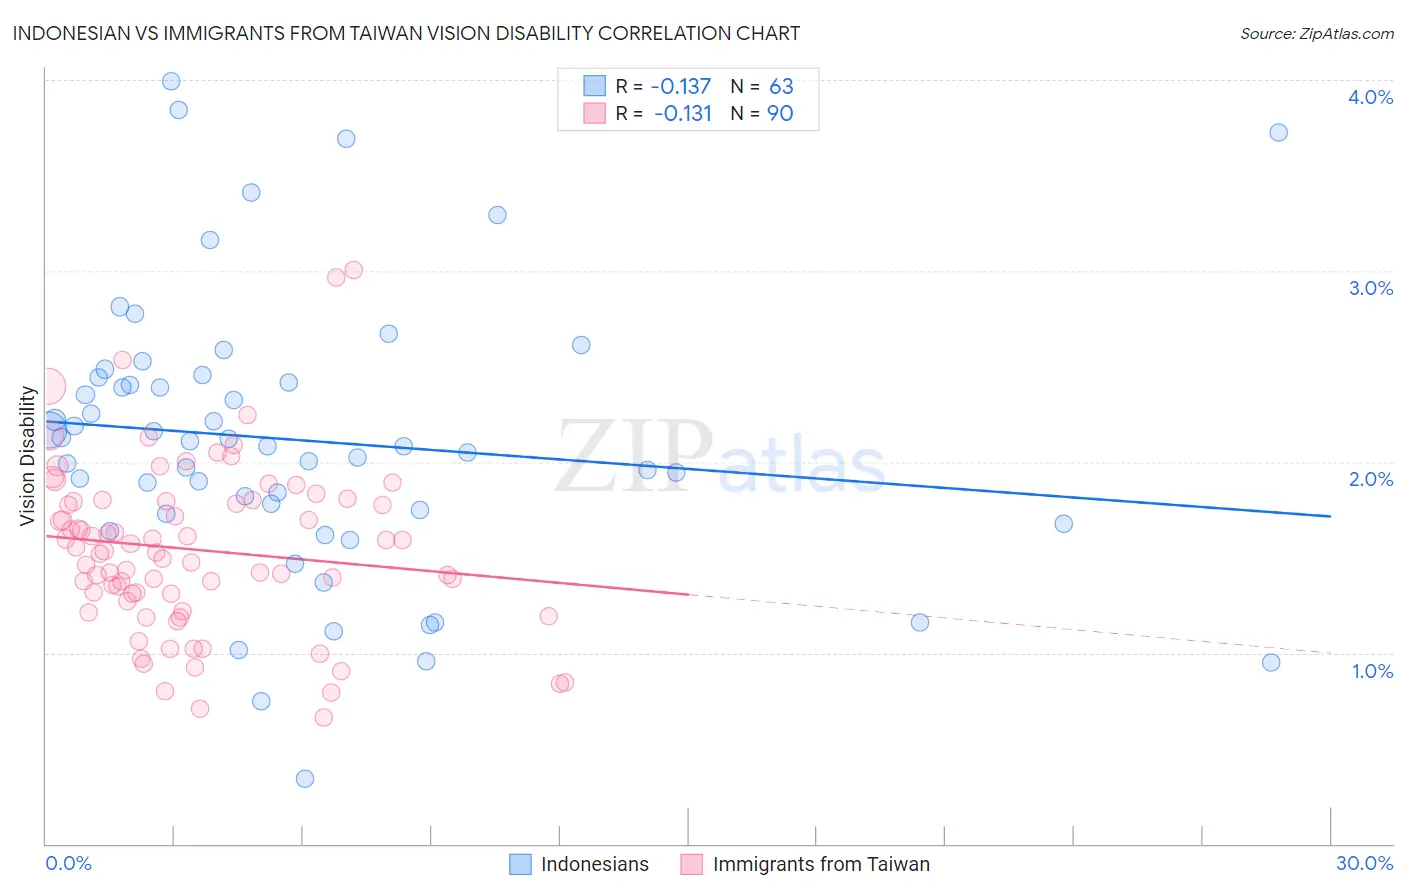
Indonesian vs Immigrants from Taiwan Vision Disability Correlation Chart
The statistical analysis conducted on geographies consisting of 162,708,643 people shows a poor negative correlation between the proportion of Indonesians and percentage of population with vision disability in the United States with a correlation coefficient (R) of -0.137 and weighted average of 2.2%. Similarly, the statistical analysis conducted on geographies consisting of 298,112,915 people shows a poor negative correlation between the proportion of Immigrants from Taiwan and percentage of population with vision disability in the United States with a correlation coefficient (R) of -0.131 and weighted average of 1.7%, a difference of 32.3%.
Vision Disability Correlation Summary
| Measurement | Indonesian | Immigrants from Taiwan |
| Minimum | 0.34% | 0.66% |
| Maximum | 4.0% | 3.0% |
| Range | 3.7% | 2.3% |
| Mean | 2.1% | 1.5% |
| Median | 2.1% | 1.5% |
| Interquartile 25% (IQ1) | 1.7% | 1.3% |
| Interquartile 75% (IQ3) | 2.4% | 1.8% |
| Interquartile Range (IQR) | 0.71% | 0.49% |
| Standard Deviation (Sample) | 0.74% | 0.44% |
| Standard Deviation (Population) | 0.73% | 0.44% |
Similar Demographics by Vision Disability
Demographics Similar to Indonesians by Vision Disability
In terms of vision disability, the demographic groups most similar to Indonesians are Bermudan (2.2%, a difference of 0.090%), Immigrants from Ghana (2.2%, a difference of 0.10%), Trinidadian and Tobagonian (2.2%, a difference of 0.23%), Immigrants from Uruguay (2.2%, a difference of 0.34%), and Nigerian (2.3%, a difference of 0.44%).
| Demographics | Rating | Rank | Vision Disability |
| Immigrants | Guyana | 15.9 /100 | #204 | Poor 2.2% |
| Samoans | 15.7 /100 | #205 | Poor 2.2% |
| Pennsylvania Germans | 14.5 /100 | #206 | Poor 2.2% |
| Immigrants | Nigeria | 13.5 /100 | #207 | Poor 2.2% |
| Germans | 13.4 /100 | #208 | Poor 2.2% |
| Immigrants | Brazil | 13.1 /100 | #209 | Poor 2.2% |
| Immigrants | Uruguay | 11.5 /100 | #210 | Poor 2.2% |
| Indonesians | 9.5 /100 | #211 | Tragic 2.2% |
| Bermudans | 9.0 /100 | #212 | Tragic 2.2% |
| Immigrants | Ghana | 8.9 /100 | #213 | Tragic 2.2% |
| Trinidadians and Tobagonians | 8.2 /100 | #214 | Tragic 2.2% |
| Nigerians | 7.2 /100 | #215 | Tragic 2.3% |
| Immigrants | Trinidad and Tobago | 6.1 /100 | #216 | Tragic 2.3% |
| Barbadians | 5.1 /100 | #217 | Tragic 2.3% |
| Portuguese | 4.9 /100 | #218 | Tragic 2.3% |
Demographics Similar to Immigrants from Taiwan by Vision Disability
In terms of vision disability, the demographic groups most similar to Immigrants from Taiwan are Filipino (1.7%, a difference of 0.65%), Immigrants from India (1.7%, a difference of 0.71%), Thai (1.7%, a difference of 2.6%), Okinawan (1.8%, a difference of 4.6%), and Immigrants from Iran (1.8%, a difference of 5.2%).
| Demographics | Rating | Rank | Vision Disability |
| Immigrants | India | 100.0 /100 | #1 | Exceptional 1.7% |
| Filipinos | 100.0 /100 | #2 | Exceptional 1.7% |
| Immigrants | Taiwan | 100.0 /100 | #3 | Exceptional 1.7% |
| Thais | 100.0 /100 | #4 | Exceptional 1.7% |
| Okinawans | 100.0 /100 | #5 | Exceptional 1.8% |
| Immigrants | Iran | 100.0 /100 | #6 | Exceptional 1.8% |
| Immigrants | South Central Asia | 100.0 /100 | #7 | Exceptional 1.8% |
| Iranians | 100.0 /100 | #8 | Exceptional 1.8% |
| Immigrants | Singapore | 100.0 /100 | #9 | Exceptional 1.8% |
| Immigrants | Hong Kong | 100.0 /100 | #10 | Exceptional 1.8% |
| Immigrants | Israel | 100.0 /100 | #11 | Exceptional 1.8% |
| Immigrants | Korea | 100.0 /100 | #12 | Exceptional 1.8% |
| Immigrants | Eastern Asia | 100.0 /100 | #13 | Exceptional 1.8% |
| Immigrants | China | 100.0 /100 | #14 | Exceptional 1.8% |
| Immigrants | Bolivia | 100.0 /100 | #15 | Exceptional 1.8% |