Immigrants from Congo vs Japanese Vision Disability
COMPARE
Immigrants from Congo
Japanese
Vision Disability
Vision Disability Comparison
Immigrants from Congo
Japanese
2.3%
VISION DISABILITY
1.4/ 100
METRIC RATING
236th/ 347
METRIC RANK
2.4%
VISION DISABILITY
0.3/ 100
METRIC RATING
253rd/ 347
METRIC RANK
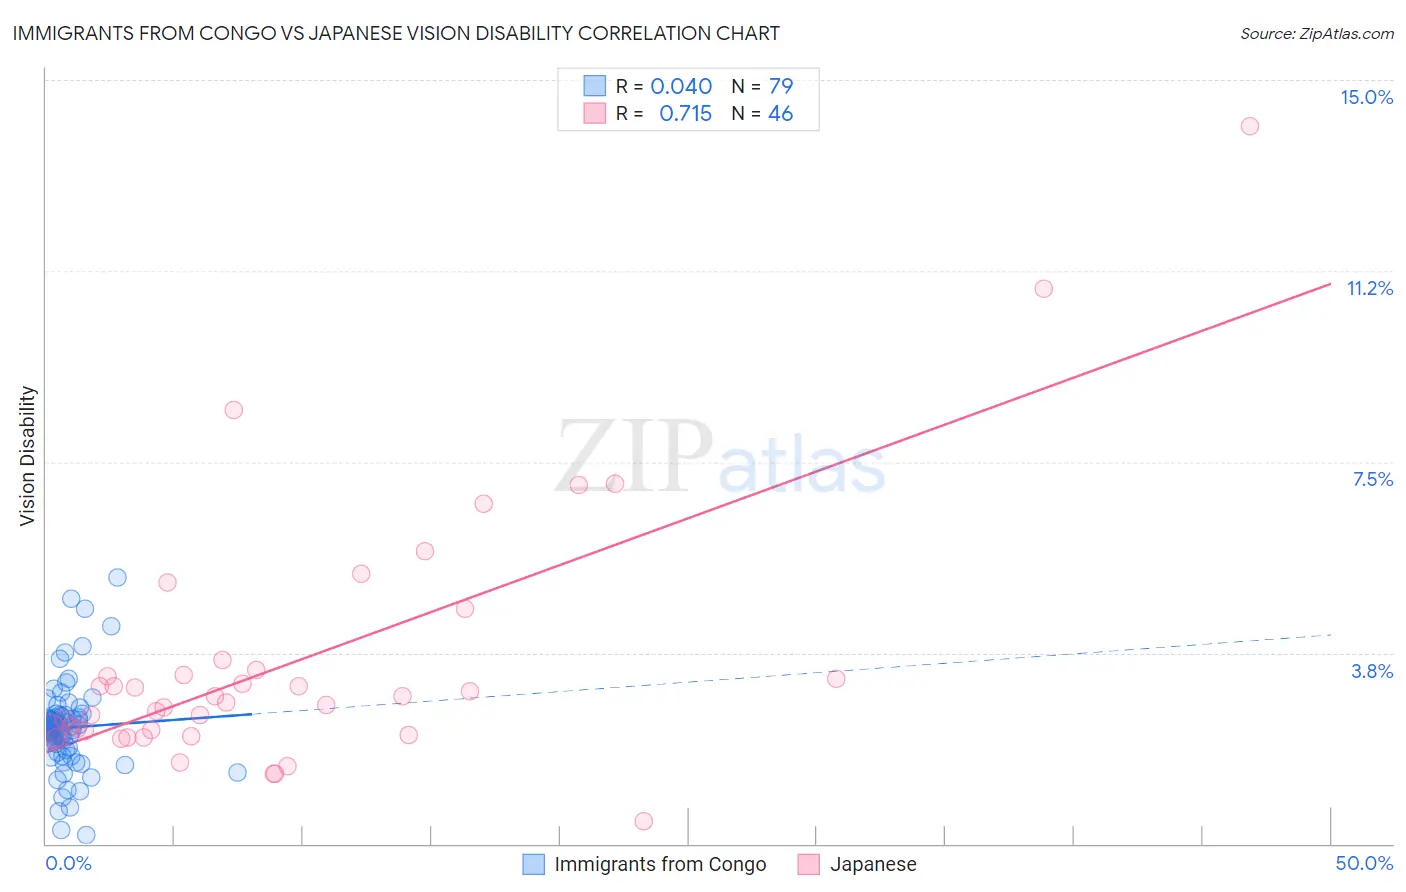
Immigrants from Congo vs Japanese Vision Disability Correlation Chart
The statistical analysis conducted on geographies consisting of 92,098,538 people shows no correlation between the proportion of Immigrants from Congo and percentage of population with vision disability in the United States with a correlation coefficient (R) of 0.040 and weighted average of 2.3%. Similarly, the statistical analysis conducted on geographies consisting of 249,077,012 people shows a strong positive correlation between the proportion of Japanese and percentage of population with vision disability in the United States with a correlation coefficient (R) of 0.715 and weighted average of 2.4%, a difference of 2.1%.
Vision Disability Correlation Summary
| Measurement | Immigrants from Congo | Japanese |
| Minimum | 0.17% | 0.43% |
| Maximum | 5.2% | 14.1% |
| Range | 5.1% | 13.7% |
| Mean | 2.3% | 3.6% |
| Median | 2.3% | 2.8% |
| Interquartile 25% (IQ1) | 1.8% | 2.2% |
| Interquartile 75% (IQ3) | 2.5% | 3.4% |
| Interquartile Range (IQR) | 0.67% | 1.2% |
| Standard Deviation (Sample) | 0.89% | 2.6% |
| Standard Deviation (Population) | 0.89% | 2.5% |
Demographics Similar to Immigrants from Congo and Japanese by Vision Disability
In terms of vision disability, the demographic groups most similar to Immigrants from Congo are Immigrants from Portugal (2.3%, a difference of 0.050%), Marshallese (2.3%, a difference of 0.090%), Scottish (2.3%, a difference of 0.16%), Immigrants from Cambodia (2.3%, a difference of 0.32%), and English (2.3%, a difference of 0.34%). Similarly, the demographic groups most similar to Japanese are Immigrants from Micronesia (2.4%, a difference of 0.070%), Haitian (2.4%, a difference of 0.28%), Immigrants from Laos (2.4%, a difference of 0.39%), Bangladeshi (2.3%, a difference of 0.50%), and Liberian (2.3%, a difference of 0.58%).
| Demographics | Rating | Rank | Vision Disability |
| Scottish | 1.6 /100 | #234 | Tragic 2.3% |
| Marshallese | 1.5 /100 | #235 | Tragic 2.3% |
| Immigrants | Congo | 1.4 /100 | #236 | Tragic 2.3% |
| Immigrants | Portugal | 1.4 /100 | #237 | Tragic 2.3% |
| Immigrants | Cambodia | 1.1 /100 | #238 | Tragic 2.3% |
| English | 1.1 /100 | #239 | Tragic 2.3% |
| Panamanians | 0.9 /100 | #240 | Tragic 2.3% |
| Malaysians | 0.9 /100 | #241 | Tragic 2.3% |
| Immigrants | Panama | 0.8 /100 | #242 | Tragic 2.3% |
| Immigrants | Nicaragua | 0.6 /100 | #243 | Tragic 2.3% |
| Immigrants | West Indies | 0.6 /100 | #244 | Tragic 2.3% |
| Alsatians | 0.6 /100 | #245 | Tragic 2.3% |
| French | 0.5 /100 | #246 | Tragic 2.3% |
| Guatemalans | 0.5 /100 | #247 | Tragic 2.3% |
| Sub-Saharan Africans | 0.5 /100 | #248 | Tragic 2.3% |
| Liberians | 0.5 /100 | #249 | Tragic 2.3% |
| Bangladeshis | 0.5 /100 | #250 | Tragic 2.3% |
| Immigrants | Laos | 0.4 /100 | #251 | Tragic 2.4% |
| Immigrants | Micronesia | 0.3 /100 | #252 | Tragic 2.4% |
| Japanese | 0.3 /100 | #253 | Tragic 2.4% |
| Haitians | 0.3 /100 | #254 | Tragic 2.4% |