Indonesian vs Immigrants from Germany Master's Degree
COMPARE
Indonesian
Immigrants from Germany
Master's Degree
Master's Degree Comparison
Indonesians
Immigrants from Germany
12.6%
MASTER'S DEGREE
0.8/ 100
METRIC RATING
254th/ 347
METRIC RANK
15.8%
MASTER'S DEGREE
85.9/ 100
METRIC RATING
139th/ 347
METRIC RANK
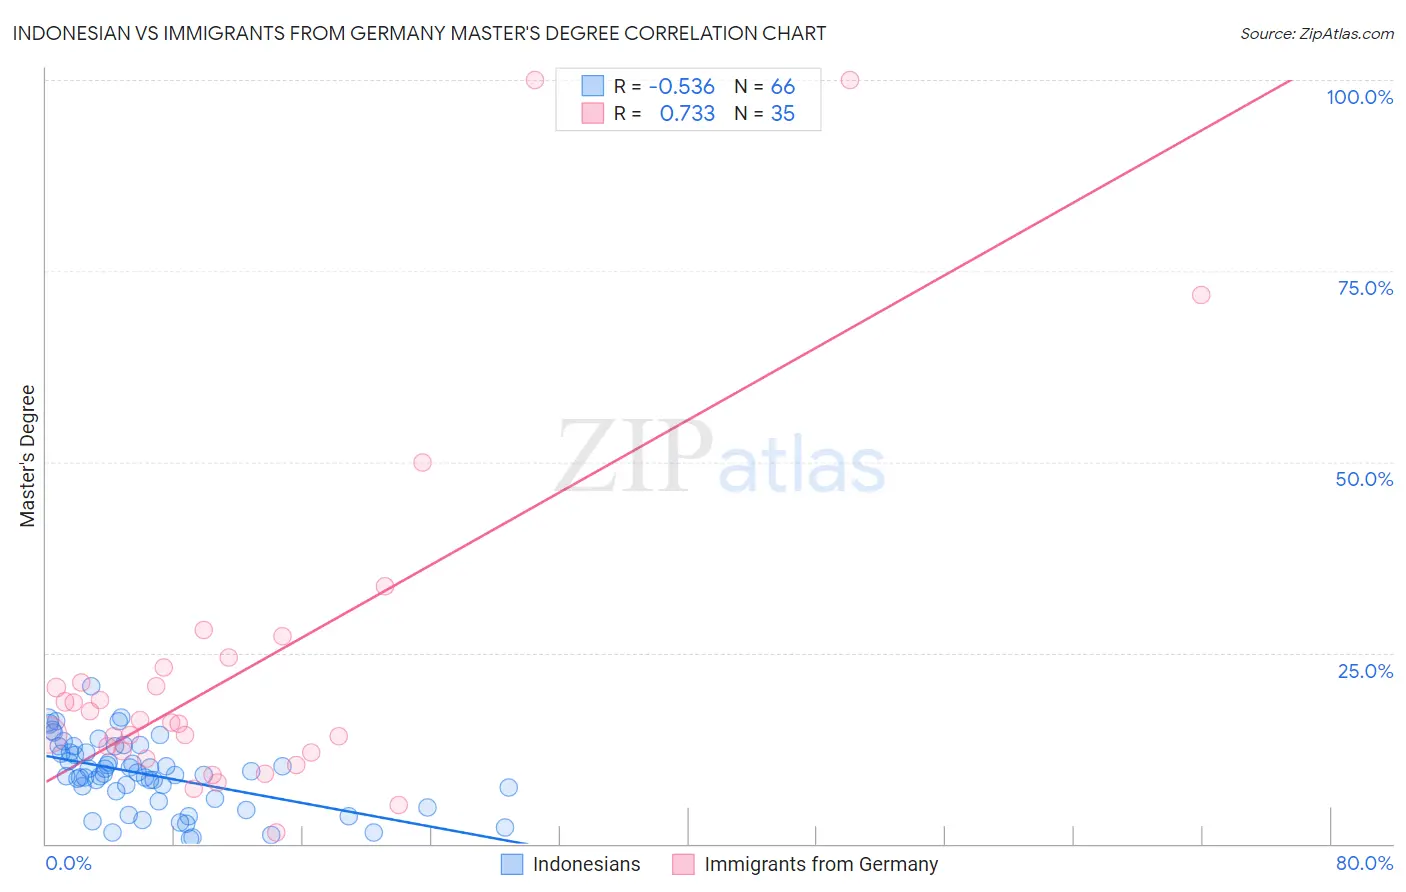
Indonesian vs Immigrants from Germany Master's Degree Correlation Chart
The statistical analysis conducted on geographies consisting of 162,683,537 people shows a substantial negative correlation between the proportion of Indonesians and percentage of population with at least master's degree education in the United States with a correlation coefficient (R) of -0.536 and weighted average of 12.6%. Similarly, the statistical analysis conducted on geographies consisting of 463,768,587 people shows a strong positive correlation between the proportion of Immigrants from Germany and percentage of population with at least master's degree education in the United States with a correlation coefficient (R) of 0.733 and weighted average of 15.8%, a difference of 24.8%.
Master's Degree Correlation Summary
| Measurement | Indonesian | Immigrants from Germany |
| Minimum | 0.73% | 1.5% |
| Maximum | 20.6% | 100.0% |
| Range | 19.8% | 98.5% |
| Mean | 9.0% | 23.2% |
| Median | 9.1% | 15.9% |
| Interquartile 25% (IQ1) | 5.8% | 11.9% |
| Interquartile 75% (IQ3) | 12.0% | 23.0% |
| Interquartile Range (IQR) | 6.2% | 11.1% |
| Standard Deviation (Sample) | 4.5% | 23.1% |
| Standard Deviation (Population) | 4.5% | 22.7% |
Similar Demographics by Master's Degree
Demographics Similar to Indonesians by Master's Degree
In terms of master's degree, the demographic groups most similar to Indonesians are Immigrants from Congo (12.6%, a difference of 0.030%), Immigrants from Dominica (12.6%, a difference of 0.040%), Immigrants from Portugal (12.6%, a difference of 0.10%), Osage (12.6%, a difference of 0.58%), and French American Indian (12.7%, a difference of 0.59%).
| Demographics | Rating | Rank | Master's Degree |
| Iroquois | 1.4 /100 | #247 | Tragic 12.9% |
| Africans | 1.4 /100 | #248 | Tragic 12.9% |
| Cree | 1.3 /100 | #249 | Tragic 12.8% |
| Liberians | 1.3 /100 | #250 | Tragic 12.8% |
| Tlingit-Haida | 1.3 /100 | #251 | Tragic 12.8% |
| French American Indians | 1.0 /100 | #252 | Tragic 12.7% |
| Immigrants | Dominica | 0.8 /100 | #253 | Tragic 12.6% |
| Indonesians | 0.8 /100 | #254 | Tragic 12.6% |
| Immigrants | Congo | 0.8 /100 | #255 | Tragic 12.6% |
| Immigrants | Portugal | 0.8 /100 | #256 | Tragic 12.6% |
| Osage | 0.7 /100 | #257 | Tragic 12.6% |
| Immigrants | Liberia | 0.6 /100 | #258 | Tragic 12.5% |
| Japanese | 0.6 /100 | #259 | Tragic 12.5% |
| Dominicans | 0.6 /100 | #260 | Tragic 12.5% |
| Tongans | 0.6 /100 | #261 | Tragic 12.5% |
Demographics Similar to Immigrants from Germany by Master's Degree
In terms of master's degree, the demographic groups most similar to Immigrants from Germany are Pakistani (15.8%, a difference of 0.060%), Vietnamese (15.8%, a difference of 0.090%), European (15.8%, a difference of 0.14%), Polish (15.7%, a difference of 0.21%), and Assyrian/Chaldean/Syriac (15.8%, a difference of 0.24%).
| Demographics | Rating | Rank | Master's Degree |
| Serbians | 91.7 /100 | #132 | Exceptional 16.1% |
| Immigrants | Sudan | 90.2 /100 | #133 | Exceptional 16.0% |
| Venezuelans | 88.4 /100 | #134 | Excellent 15.9% |
| South American Indians | 88.4 /100 | #135 | Excellent 15.9% |
| Assyrians/Chaldeans/Syriacs | 86.8 /100 | #136 | Excellent 15.8% |
| Europeans | 86.4 /100 | #137 | Excellent 15.8% |
| Pakistanis | 86.1 /100 | #138 | Excellent 15.8% |
| Immigrants | Germany | 85.9 /100 | #139 | Excellent 15.8% |
| Vietnamese | 85.5 /100 | #140 | Excellent 15.8% |
| Poles | 85.0 /100 | #141 | Excellent 15.7% |
| Immigrants | Africa | 84.0 /100 | #142 | Excellent 15.7% |
| Immigrants | Venezuela | 83.6 /100 | #143 | Excellent 15.7% |
| Canadians | 83.3 /100 | #144 | Excellent 15.7% |
| South Americans | 81.3 /100 | #145 | Excellent 15.6% |
| Immigrants | Afghanistan | 79.4 /100 | #146 | Good 15.6% |