Indonesian vs Immigrants from Poland Self-Care Disability
COMPARE
Indonesian
Immigrants from Poland
Self-Care Disability
Self-Care Disability Comparison
Indonesians
Immigrants from Poland
2.5%
SELF-CARE DISABILITY
41.2/ 100
METRIC RATING
180th/ 347
METRIC RANK
2.4%
SELF-CARE DISABILITY
96.4/ 100
METRIC RATING
98th/ 347
METRIC RANK
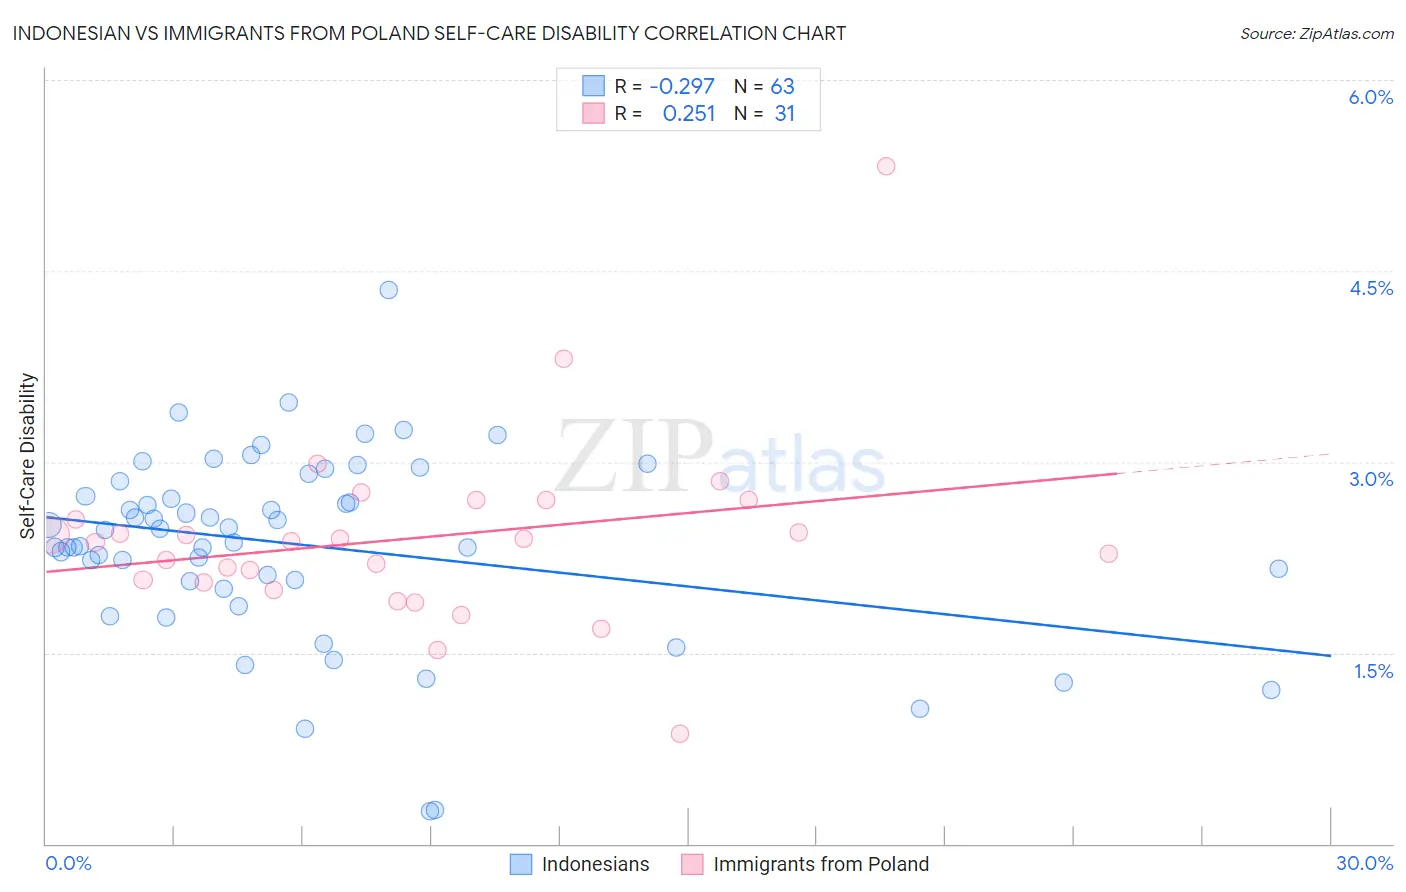
Indonesian vs Immigrants from Poland Self-Care Disability Correlation Chart
The statistical analysis conducted on geographies consisting of 162,620,981 people shows a weak negative correlation between the proportion of Indonesians and percentage of population with self-care disability in the United States with a correlation coefficient (R) of -0.297 and weighted average of 2.5%. Similarly, the statistical analysis conducted on geographies consisting of 304,690,166 people shows a weak positive correlation between the proportion of Immigrants from Poland and percentage of population with self-care disability in the United States with a correlation coefficient (R) of 0.251 and weighted average of 2.4%, a difference of 4.5%.
Self-Care Disability Correlation Summary
| Measurement | Indonesian | Immigrants from Poland |
| Minimum | 0.26% | 0.86% |
| Maximum | 4.4% | 5.3% |
| Range | 4.1% | 4.5% |
| Mean | 2.3% | 2.4% |
| Median | 2.5% | 2.4% |
| Interquartile 25% (IQ1) | 2.1% | 2.1% |
| Interquartile 75% (IQ3) | 2.8% | 2.7% |
| Interquartile Range (IQR) | 0.79% | 0.65% |
| Standard Deviation (Sample) | 0.74% | 0.74% |
| Standard Deviation (Population) | 0.74% | 0.73% |
Similar Demographics by Self-Care Disability
Demographics Similar to Indonesians by Self-Care Disability
In terms of self-care disability, the demographic groups most similar to Indonesians are Ghanaian (2.5%, a difference of 0.040%), Maltese (2.5%, a difference of 0.19%), Hungarian (2.5%, a difference of 0.21%), English (2.5%, a difference of 0.24%), and Salvadoran (2.5%, a difference of 0.24%).
| Demographics | Rating | Rank | Self-Care Disability |
| Immigrants | Burma/Myanmar | 52.8 /100 | #173 | Average 2.5% |
| Welsh | 50.0 /100 | #174 | Average 2.5% |
| Immigrants | Bosnia and Herzegovina | 49.6 /100 | #175 | Average 2.5% |
| Immigrants | Afghanistan | 47.6 /100 | #176 | Average 2.5% |
| Immigrants | Kazakhstan | 46.7 /100 | #177 | Average 2.5% |
| English | 46.2 /100 | #178 | Average 2.5% |
| Hungarians | 45.5 /100 | #179 | Average 2.5% |
| Indonesians | 41.2 /100 | #180 | Average 2.5% |
| Ghanaians | 40.4 /100 | #181 | Average 2.5% |
| Maltese | 37.5 /100 | #182 | Fair 2.5% |
| Salvadorans | 36.4 /100 | #183 | Fair 2.5% |
| Yugoslavians | 36.1 /100 | #184 | Fair 2.5% |
| Slavs | 34.3 /100 | #185 | Fair 2.5% |
| Immigrants | El Salvador | 33.0 /100 | #186 | Fair 2.5% |
| Irish | 28.7 /100 | #187 | Fair 2.5% |
Demographics Similar to Immigrants from Poland by Self-Care Disability
In terms of self-care disability, the demographic groups most similar to Immigrants from Poland are Immigrants from Israel (2.4%, a difference of 0.080%), Swiss (2.4%, a difference of 0.090%), Immigrants from Chile (2.4%, a difference of 0.14%), European (2.4%, a difference of 0.18%), and Immigrants from Asia (2.4%, a difference of 0.19%).
| Demographics | Rating | Rank | Self-Care Disability |
| Immigrants | Jordan | 97.7 /100 | #91 | Exceptional 2.4% |
| Icelanders | 97.4 /100 | #92 | Exceptional 2.4% |
| Immigrants | Latvia | 97.0 /100 | #93 | Exceptional 2.4% |
| Macedonians | 96.9 /100 | #94 | Exceptional 2.4% |
| Immigrants | Asia | 96.9 /100 | #95 | Exceptional 2.4% |
| Immigrants | Chile | 96.7 /100 | #96 | Exceptional 2.4% |
| Swiss | 96.6 /100 | #97 | Exceptional 2.4% |
| Immigrants | Poland | 96.4 /100 | #98 | Exceptional 2.4% |
| Immigrants | Israel | 96.1 /100 | #99 | Exceptional 2.4% |
| Europeans | 95.8 /100 | #100 | Exceptional 2.4% |
| Immigrants | Scotland | 95.7 /100 | #101 | Exceptional 2.4% |
| Croatians | 95.0 /100 | #102 | Exceptional 2.4% |
| Alsatians | 94.9 /100 | #103 | Exceptional 2.4% |
| Bhutanese | 94.5 /100 | #104 | Exceptional 2.4% |
| Carpatho Rusyns | 94.4 /100 | #105 | Exceptional 2.4% |