Indian (Asian) vs Bangladeshi Male Disability
COMPARE
Indian (Asian)
Bangladeshi
Male Disability
Male Disability Comparison
Indians (Asian)
Bangladeshis
9.7%
MALE DISABILITY
100.0/ 100
METRIC RATING
15th/ 347
METRIC RANK
12.0%
MALE DISABILITY
0.5/ 100
METRIC RATING
250th/ 347
METRIC RANK
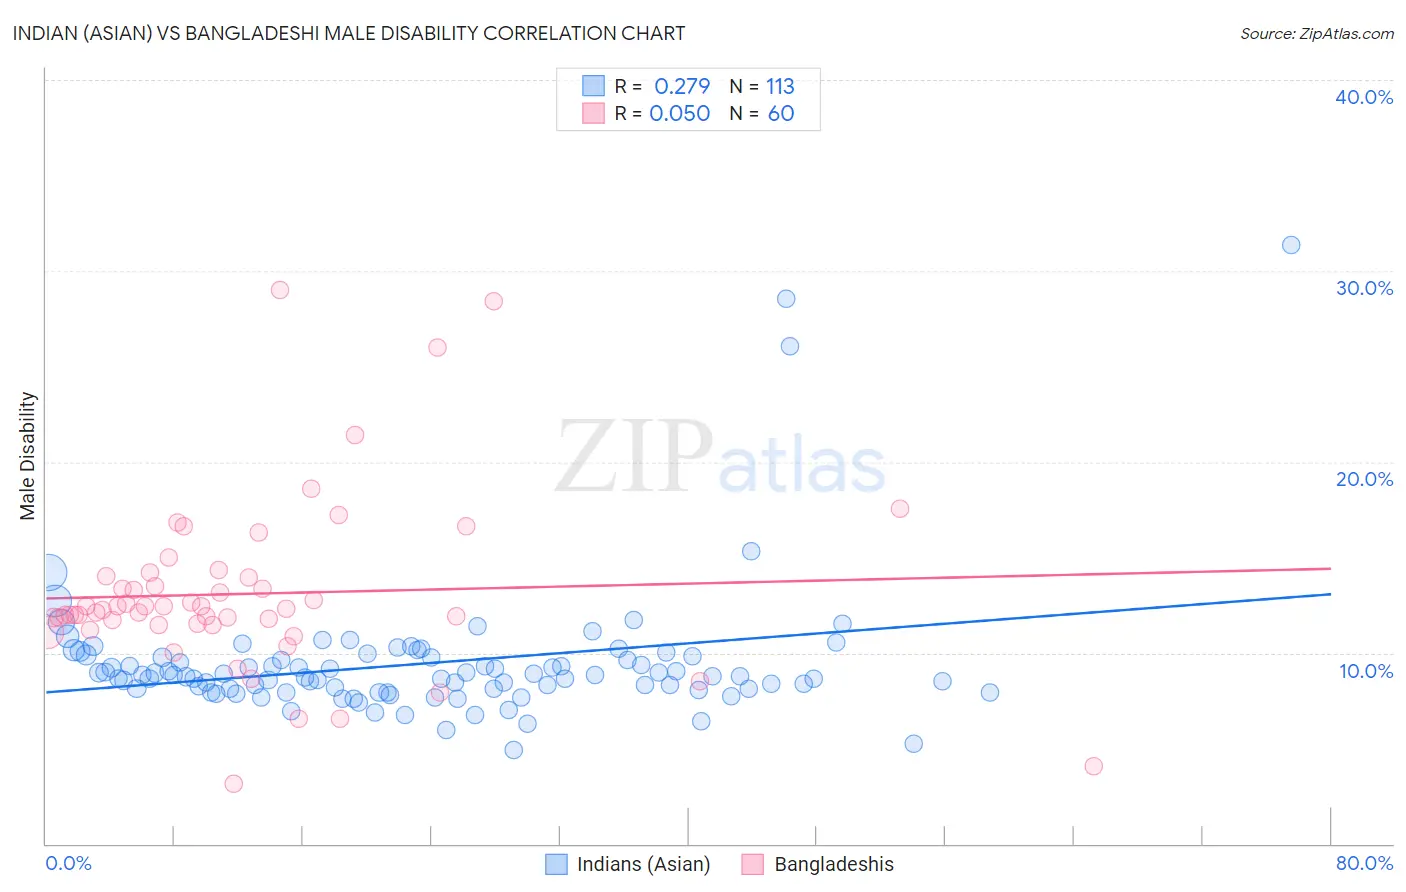
Indian (Asian) vs Bangladeshi Male Disability Correlation Chart
The statistical analysis conducted on geographies consisting of 495,201,745 people shows a weak positive correlation between the proportion of Indians (Asian) and percentage of males with a disability in the United States with a correlation coefficient (R) of 0.279 and weighted average of 9.7%. Similarly, the statistical analysis conducted on geographies consisting of 141,384,534 people shows a slight positive correlation between the proportion of Bangladeshis and percentage of males with a disability in the United States with a correlation coefficient (R) of 0.050 and weighted average of 12.0%, a difference of 23.8%.
Male Disability Correlation Summary
| Measurement | Indian (Asian) | Bangladeshi |
| Minimum | 4.9% | 3.2% |
| Maximum | 31.4% | 29.0% |
| Range | 26.5% | 25.8% |
| Mean | 9.4% | 13.1% |
| Median | 8.8% | 12.3% |
| Interquartile 25% (IQ1) | 8.1% | 11.5% |
| Interquartile 75% (IQ3) | 9.8% | 14.0% |
| Interquartile Range (IQR) | 1.7% | 2.5% |
| Standard Deviation (Sample) | 3.5% | 4.6% |
| Standard Deviation (Population) | 3.5% | 4.6% |
Similar Demographics by Male Disability
Demographics Similar to Indians (Asian) by Male Disability
In terms of male disability, the demographic groups most similar to Indians (Asian) are Immigrants from Iran (9.7%, a difference of 0.45%), Iranian (9.7%, a difference of 0.55%), Okinawan (9.8%, a difference of 0.61%), Immigrants from Korea (9.8%, a difference of 0.75%), and Bolivian (9.6%, a difference of 0.78%).
| Demographics | Rating | Rank | Male Disability |
| Immigrants | China | 100.0 /100 | #8 | Exceptional 9.5% |
| Immigrants | Singapore | 100.0 /100 | #9 | Exceptional 9.5% |
| Immigrants | Israel | 100.0 /100 | #10 | Exceptional 9.6% |
| Immigrants | Eastern Asia | 100.0 /100 | #11 | Exceptional 9.6% |
| Bolivians | 100.0 /100 | #12 | Exceptional 9.6% |
| Iranians | 100.0 /100 | #13 | Exceptional 9.7% |
| Immigrants | Iran | 100.0 /100 | #14 | Exceptional 9.7% |
| Indians (Asian) | 100.0 /100 | #15 | Exceptional 9.7% |
| Okinawans | 100.0 /100 | #16 | Exceptional 9.8% |
| Immigrants | Korea | 100.0 /100 | #17 | Exceptional 9.8% |
| Immigrants | Pakistan | 100.0 /100 | #18 | Exceptional 9.8% |
| Immigrants | Sri Lanka | 100.0 /100 | #19 | Exceptional 10.0% |
| Asians | 100.0 /100 | #20 | Exceptional 10.0% |
| Burmese | 100.0 /100 | #21 | Exceptional 10.0% |
| Immigrants | Venezuela | 100.0 /100 | #22 | Exceptional 10.0% |
Demographics Similar to Bangladeshis by Male Disability
In terms of male disability, the demographic groups most similar to Bangladeshis are German Russian (12.0%, a difference of 0.010%), Immigrants from Yemen (12.0%, a difference of 0.050%), Slovene (12.0%, a difference of 0.080%), Guamanian/Chamorro (12.0%, a difference of 0.080%), and British (12.1%, a difference of 0.27%).
| Demographics | Rating | Rank | Male Disability |
| Samoans | 1.1 /100 | #243 | Tragic 11.9% |
| Immigrants | Laos | 1.0 /100 | #244 | Tragic 11.9% |
| Immigrants | Liberia | 1.0 /100 | #245 | Tragic 11.9% |
| Danes | 0.9 /100 | #246 | Tragic 11.9% |
| Hungarians | 0.8 /100 | #247 | Tragic 12.0% |
| Poles | 0.7 /100 | #248 | Tragic 12.0% |
| Immigrants | Yemen | 0.5 /100 | #249 | Tragic 12.0% |
| Bangladeshis | 0.5 /100 | #250 | Tragic 12.0% |
| German Russians | 0.5 /100 | #251 | Tragic 12.0% |
| Slovenes | 0.5 /100 | #252 | Tragic 12.0% |
| Guamanians/Chamorros | 0.5 /100 | #253 | Tragic 12.0% |
| British | 0.4 /100 | #254 | Tragic 12.1% |
| Chinese | 0.4 /100 | #255 | Tragic 12.1% |
| Swiss | 0.3 /100 | #256 | Tragic 12.1% |
| Europeans | 0.3 /100 | #257 | Tragic 12.1% |