Indian (Asian) vs Immigrants from Cameroon Male Disability
COMPARE
Indian (Asian)
Immigrants from Cameroon
Male Disability
Male Disability Comparison
Indians (Asian)
Immigrants from Cameroon
9.7%
MALE DISABILITY
100.0/ 100
METRIC RATING
15th/ 347
METRIC RANK
10.5%
MALE DISABILITY
99.0/ 100
METRIC RATING
71st/ 347
METRIC RANK
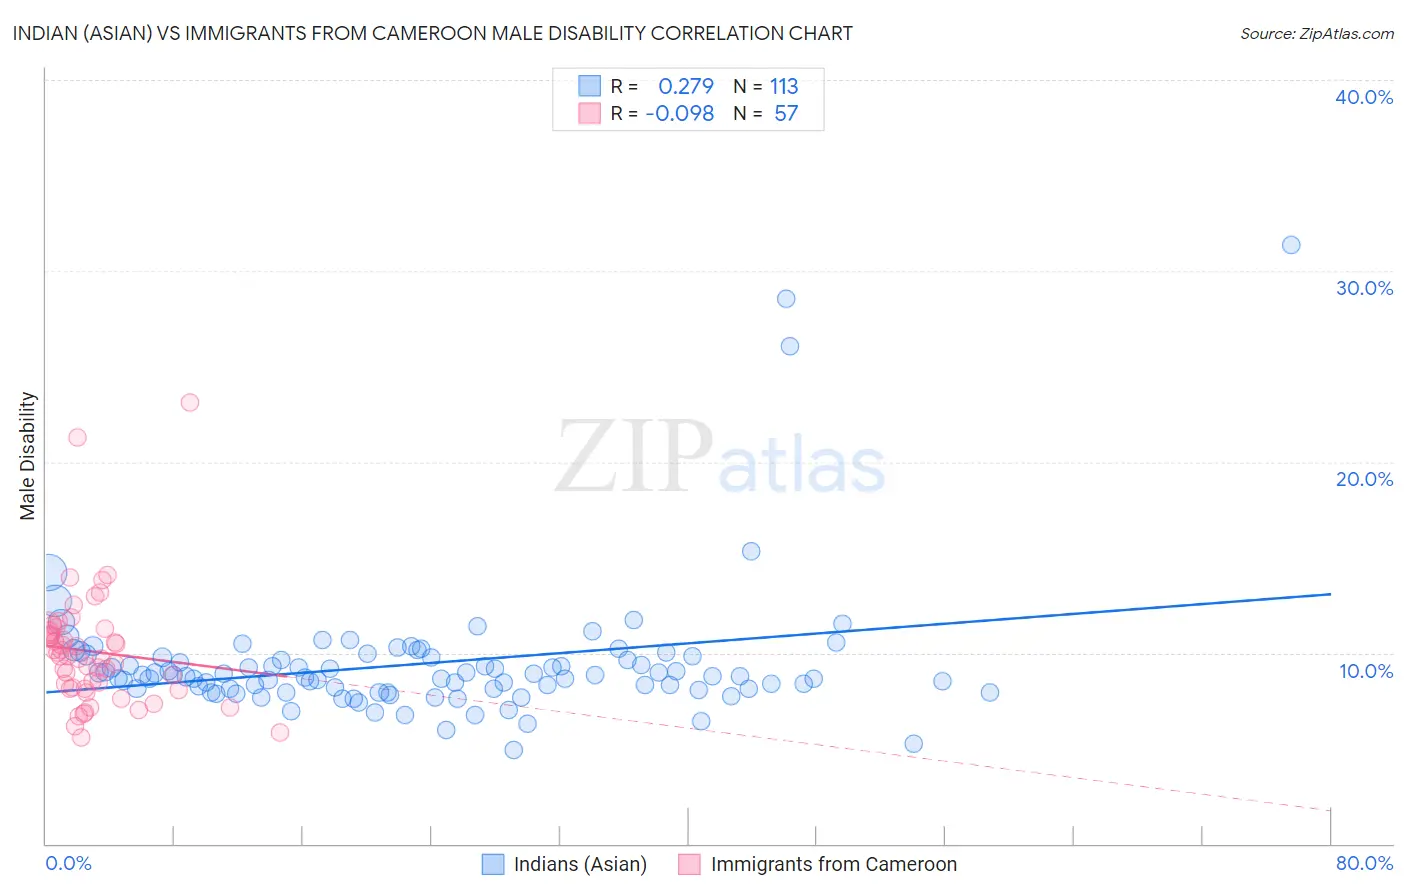
Indian (Asian) vs Immigrants from Cameroon Male Disability Correlation Chart
The statistical analysis conducted on geographies consisting of 495,201,745 people shows a weak positive correlation between the proportion of Indians (Asian) and percentage of males with a disability in the United States with a correlation coefficient (R) of 0.279 and weighted average of 9.7%. Similarly, the statistical analysis conducted on geographies consisting of 130,760,441 people shows a slight negative correlation between the proportion of Immigrants from Cameroon and percentage of males with a disability in the United States with a correlation coefficient (R) of -0.098 and weighted average of 10.5%, a difference of 8.1%.
Male Disability Correlation Summary
| Measurement | Indian (Asian) | Immigrants from Cameroon |
| Minimum | 4.9% | 5.6% |
| Maximum | 31.4% | 23.1% |
| Range | 26.5% | 17.6% |
| Mean | 9.4% | 10.1% |
| Median | 8.8% | 9.8% |
| Interquartile 25% (IQ1) | 8.1% | 8.1% |
| Interquartile 75% (IQ3) | 9.8% | 11.2% |
| Interquartile Range (IQR) | 1.7% | 3.1% |
| Standard Deviation (Sample) | 3.5% | 3.1% |
| Standard Deviation (Population) | 3.5% | 3.1% |
Similar Demographics by Male Disability
Demographics Similar to Indians (Asian) by Male Disability
In terms of male disability, the demographic groups most similar to Indians (Asian) are Immigrants from Iran (9.7%, a difference of 0.45%), Iranian (9.7%, a difference of 0.55%), Okinawan (9.8%, a difference of 0.61%), Immigrants from Korea (9.8%, a difference of 0.75%), and Bolivian (9.6%, a difference of 0.78%).
| Demographics | Rating | Rank | Male Disability |
| Immigrants | China | 100.0 /100 | #8 | Exceptional 9.5% |
| Immigrants | Singapore | 100.0 /100 | #9 | Exceptional 9.5% |
| Immigrants | Israel | 100.0 /100 | #10 | Exceptional 9.6% |
| Immigrants | Eastern Asia | 100.0 /100 | #11 | Exceptional 9.6% |
| Bolivians | 100.0 /100 | #12 | Exceptional 9.6% |
| Iranians | 100.0 /100 | #13 | Exceptional 9.7% |
| Immigrants | Iran | 100.0 /100 | #14 | Exceptional 9.7% |
| Indians (Asian) | 100.0 /100 | #15 | Exceptional 9.7% |
| Okinawans | 100.0 /100 | #16 | Exceptional 9.8% |
| Immigrants | Korea | 100.0 /100 | #17 | Exceptional 9.8% |
| Immigrants | Pakistan | 100.0 /100 | #18 | Exceptional 9.8% |
| Immigrants | Sri Lanka | 100.0 /100 | #19 | Exceptional 10.0% |
| Asians | 100.0 /100 | #20 | Exceptional 10.0% |
| Burmese | 100.0 /100 | #21 | Exceptional 10.0% |
| Immigrants | Venezuela | 100.0 /100 | #22 | Exceptional 10.0% |
Demographics Similar to Immigrants from Cameroon by Male Disability
In terms of male disability, the demographic groups most similar to Immigrants from Cameroon are Immigrants from Serbia (10.5%, a difference of 0.060%), Immigrants from Lithuania (10.5%, a difference of 0.12%), Immigrants from Bulgaria (10.5%, a difference of 0.15%), Immigrants from Lebanon (10.5%, a difference of 0.26%), and Colombian (10.5%, a difference of 0.29%).
| Demographics | Rating | Rank | Male Disability |
| Jordanians | 99.3 /100 | #64 | Exceptional 10.5% |
| Immigrants | Grenada | 99.2 /100 | #65 | Exceptional 10.5% |
| Guyanese | 99.2 /100 | #66 | Exceptional 10.5% |
| Immigrants | Afghanistan | 99.2 /100 | #67 | Exceptional 10.5% |
| Colombians | 99.2 /100 | #68 | Exceptional 10.5% |
| Ecuadorians | 99.2 /100 | #69 | Exceptional 10.5% |
| Immigrants | Bulgaria | 99.1 /100 | #70 | Exceptional 10.5% |
| Immigrants | Cameroon | 99.0 /100 | #71 | Exceptional 10.5% |
| Immigrants | Serbia | 99.0 /100 | #72 | Exceptional 10.5% |
| Immigrants | Lithuania | 98.9 /100 | #73 | Exceptional 10.5% |
| Immigrants | Lebanon | 98.8 /100 | #74 | Exceptional 10.5% |
| Sierra Leoneans | 98.7 /100 | #75 | Exceptional 10.5% |
| Immigrants | Sierra Leone | 98.7 /100 | #76 | Exceptional 10.5% |
| Laotians | 98.6 /100 | #77 | Exceptional 10.6% |
| Immigrants | Russia | 98.6 /100 | #78 | Exceptional 10.6% |