Indian (Asian) vs Liberian Male Disability
COMPARE
Indian (Asian)
Liberian
Male Disability
Male Disability Comparison
Indians (Asian)
Liberians
9.7%
MALE DISABILITY
100.0/ 100
METRIC RATING
15th/ 347
METRIC RANK
11.8%
MALE DISABILITY
3.1/ 100
METRIC RATING
225th/ 347
METRIC RANK
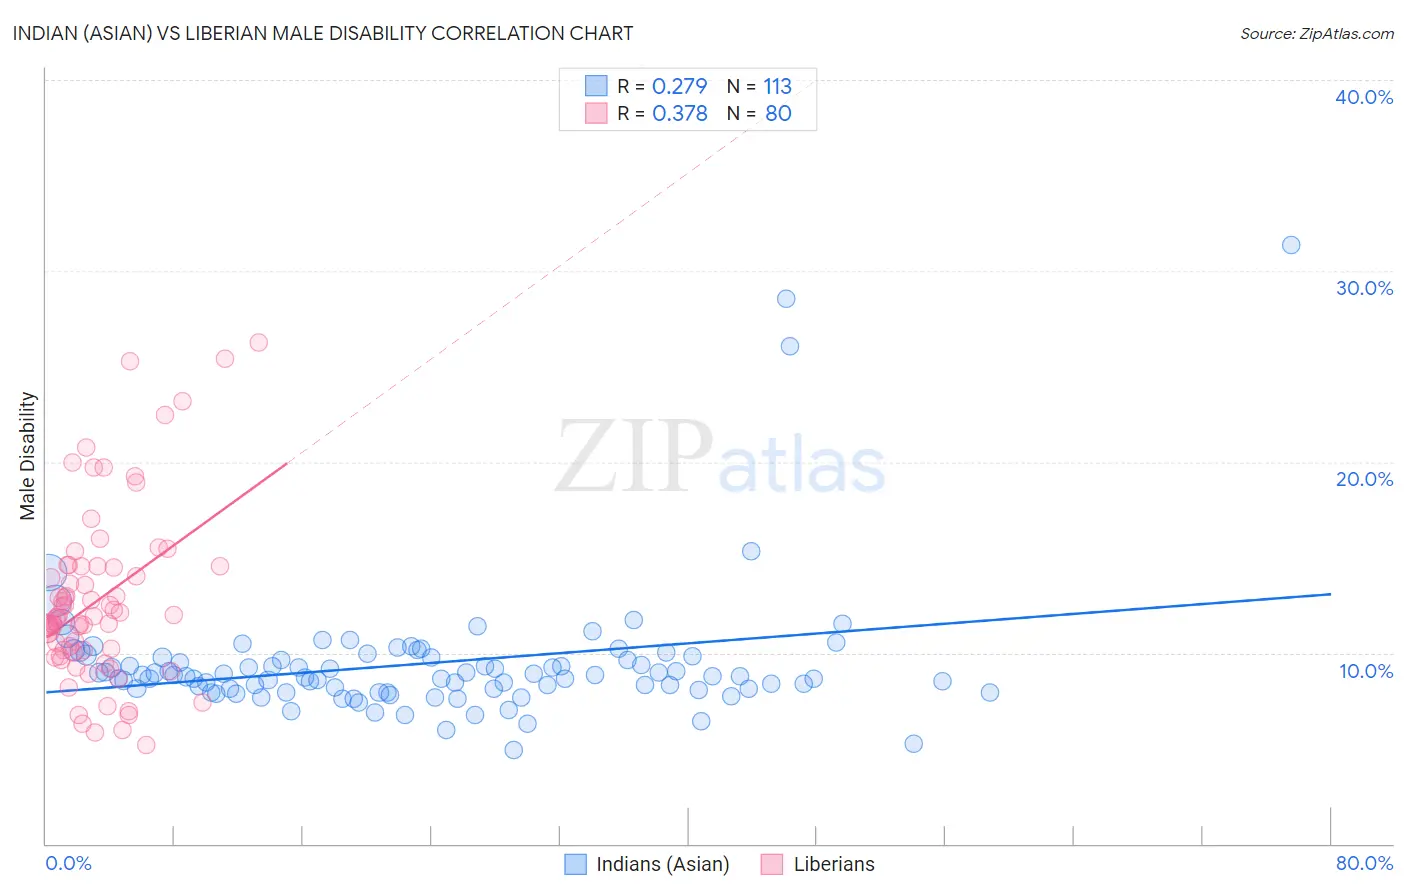
Indian (Asian) vs Liberian Male Disability Correlation Chart
The statistical analysis conducted on geographies consisting of 495,201,745 people shows a weak positive correlation between the proportion of Indians (Asian) and percentage of males with a disability in the United States with a correlation coefficient (R) of 0.279 and weighted average of 9.7%. Similarly, the statistical analysis conducted on geographies consisting of 118,082,647 people shows a mild positive correlation between the proportion of Liberians and percentage of males with a disability in the United States with a correlation coefficient (R) of 0.378 and weighted average of 11.8%, a difference of 20.9%.
Male Disability Correlation Summary
| Measurement | Indian (Asian) | Liberian |
| Minimum | 4.9% | 5.2% |
| Maximum | 31.4% | 26.3% |
| Range | 26.5% | 21.1% |
| Mean | 9.4% | 12.8% |
| Median | 8.8% | 11.9% |
| Interquartile 25% (IQ1) | 8.1% | 10.1% |
| Interquartile 75% (IQ3) | 9.8% | 14.5% |
| Interquartile Range (IQR) | 1.7% | 4.5% |
| Standard Deviation (Sample) | 3.5% | 4.5% |
| Standard Deviation (Population) | 3.5% | 4.5% |
Similar Demographics by Male Disability
Demographics Similar to Indians (Asian) by Male Disability
In terms of male disability, the demographic groups most similar to Indians (Asian) are Immigrants from Iran (9.7%, a difference of 0.45%), Iranian (9.7%, a difference of 0.55%), Okinawan (9.8%, a difference of 0.61%), Immigrants from Korea (9.8%, a difference of 0.75%), and Bolivian (9.6%, a difference of 0.78%).
| Demographics | Rating | Rank | Male Disability |
| Immigrants | China | 100.0 /100 | #8 | Exceptional 9.5% |
| Immigrants | Singapore | 100.0 /100 | #9 | Exceptional 9.5% |
| Immigrants | Israel | 100.0 /100 | #10 | Exceptional 9.6% |
| Immigrants | Eastern Asia | 100.0 /100 | #11 | Exceptional 9.6% |
| Bolivians | 100.0 /100 | #12 | Exceptional 9.6% |
| Iranians | 100.0 /100 | #13 | Exceptional 9.7% |
| Immigrants | Iran | 100.0 /100 | #14 | Exceptional 9.7% |
| Indians (Asian) | 100.0 /100 | #15 | Exceptional 9.7% |
| Okinawans | 100.0 /100 | #16 | Exceptional 9.8% |
| Immigrants | Korea | 100.0 /100 | #17 | Exceptional 9.8% |
| Immigrants | Pakistan | 100.0 /100 | #18 | Exceptional 9.8% |
| Immigrants | Sri Lanka | 100.0 /100 | #19 | Exceptional 10.0% |
| Asians | 100.0 /100 | #20 | Exceptional 10.0% |
| Burmese | 100.0 /100 | #21 | Exceptional 10.0% |
| Immigrants | Venezuela | 100.0 /100 | #22 | Exceptional 10.0% |
Demographics Similar to Liberians by Male Disability
In terms of male disability, the demographic groups most similar to Liberians are Japanese (11.7%, a difference of 0.010%), Immigrants from Bahamas (11.7%, a difference of 0.030%), Alsatian (11.7%, a difference of 0.12%), Subsaharan African (11.8%, a difference of 0.12%), and Immigrants from Congo (11.7%, a difference of 0.27%).
| Demographics | Rating | Rank | Male Disability |
| Immigrants | England | 4.0 /100 | #218 | Tragic 11.7% |
| Panamanians | 3.8 /100 | #219 | Tragic 11.7% |
| Immigrants | Western Europe | 3.8 /100 | #220 | Tragic 11.7% |
| Immigrants | Congo | 3.7 /100 | #221 | Tragic 11.7% |
| Alsatians | 3.3 /100 | #222 | Tragic 11.7% |
| Immigrants | Bahamas | 3.2 /100 | #223 | Tragic 11.7% |
| Japanese | 3.1 /100 | #224 | Tragic 11.7% |
| Liberians | 3.1 /100 | #225 | Tragic 11.8% |
| Sub-Saharan Africans | 2.8 /100 | #226 | Tragic 11.8% |
| Austrians | 2.5 /100 | #227 | Tragic 11.8% |
| Hispanics or Latinos | 2.3 /100 | #228 | Tragic 11.8% |
| Bermudans | 2.3 /100 | #229 | Tragic 11.8% |
| Croatians | 2.1 /100 | #230 | Tragic 11.8% |
| Dominicans | 1.8 /100 | #231 | Tragic 11.8% |
| Malaysians | 1.8 /100 | #232 | Tragic 11.8% |