Indian (Asian) vs Immigrants from Guatemala Disability Age 5 to 17
COMPARE
Indian (Asian)
Immigrants from Guatemala
Disability Age 5 to 17
Disability Age 5 to 17 Comparison
Indians (Asian)
Immigrants from Guatemala
4.6%
DISABILITY AGE 5 TO 17
100.0/ 100
METRIC RATING
8th/ 347
METRIC RANK
5.5%
DISABILITY AGE 5 TO 17
86.6/ 100
METRIC RATING
145th/ 347
METRIC RANK
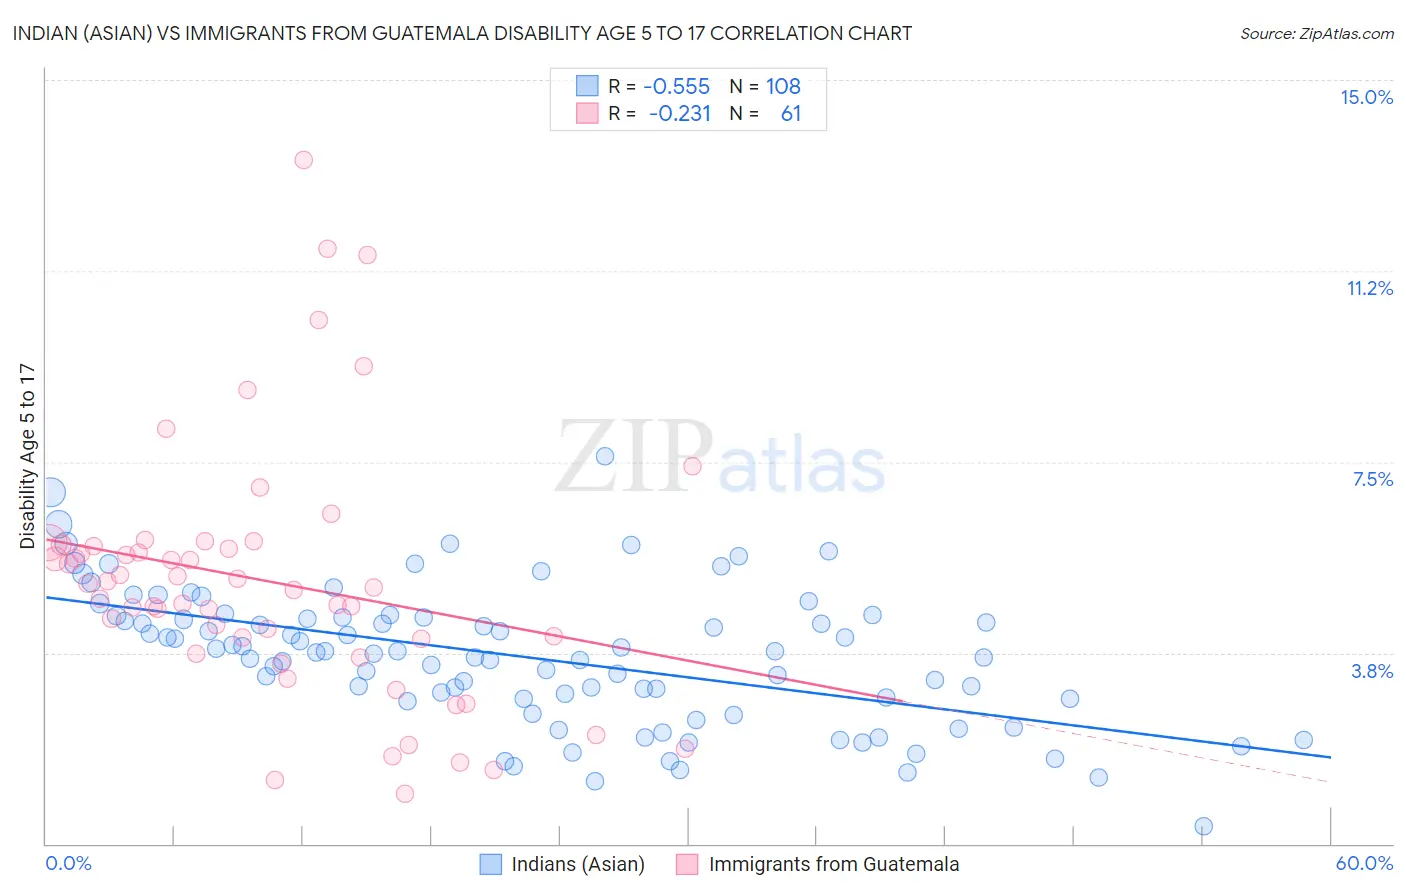
Indian (Asian) vs Immigrants from Guatemala Disability Age 5 to 17 Correlation Chart
The statistical analysis conducted on geographies consisting of 488,980,607 people shows a substantial negative correlation between the proportion of Indians (Asian) and percentage of population with a disability between the ages 5 and 17 in the United States with a correlation coefficient (R) of -0.555 and weighted average of 4.6%. Similarly, the statistical analysis conducted on geographies consisting of 375,293,918 people shows a weak negative correlation between the proportion of Immigrants from Guatemala and percentage of population with a disability between the ages 5 and 17 in the United States with a correlation coefficient (R) of -0.231 and weighted average of 5.5%, a difference of 19.8%.
Disability Age 5 to 17 Correlation Summary
| Measurement | Indian (Asian) | Immigrants from Guatemala |
| Minimum | 0.35% | 0.98% |
| Maximum | 7.6% | 13.4% |
| Range | 7.3% | 12.4% |
| Mean | 3.7% | 5.2% |
| Median | 3.8% | 5.0% |
| Interquartile 25% (IQ1) | 2.8% | 3.9% |
| Interquartile 75% (IQ3) | 4.4% | 5.8% |
| Interquartile Range (IQR) | 1.6% | 2.0% |
| Standard Deviation (Sample) | 1.3% | 2.5% |
| Standard Deviation (Population) | 1.3% | 2.5% |
Similar Demographics by Disability Age 5 to 17
Demographics Similar to Indians (Asian) by Disability Age 5 to 17
In terms of disability age 5 to 17, the demographic groups most similar to Indians (Asian) are Immigrants from Eastern Asia (4.6%, a difference of 0.33%), Immigrants from India (4.6%, a difference of 0.40%), Armenian (4.6%, a difference of 0.56%), Iranian (4.6%, a difference of 0.80%), and Immigrants from China (4.5%, a difference of 0.93%).
| Demographics | Rating | Rank | Disability Age 5 to 17 |
| Immigrants | Armenia | 100.0 /100 | #1 | Exceptional 4.1% |
| Immigrants | Taiwan | 100.0 /100 | #2 | Exceptional 4.2% |
| Immigrants | Hong Kong | 100.0 /100 | #3 | Exceptional 4.3% |
| Filipinos | 100.0 /100 | #4 | Exceptional 4.3% |
| Immigrants | Iran | 100.0 /100 | #5 | Exceptional 4.4% |
| Immigrants | Israel | 100.0 /100 | #6 | Exceptional 4.5% |
| Immigrants | China | 100.0 /100 | #7 | Exceptional 4.5% |
| Indians (Asian) | 100.0 /100 | #8 | Exceptional 4.6% |
| Immigrants | Eastern Asia | 100.0 /100 | #9 | Exceptional 4.6% |
| Immigrants | India | 100.0 /100 | #10 | Exceptional 4.6% |
| Armenians | 100.0 /100 | #11 | Exceptional 4.6% |
| Iranians | 100.0 /100 | #12 | Exceptional 4.6% |
| Thais | 100.0 /100 | #13 | Exceptional 4.7% |
| Immigrants | Korea | 100.0 /100 | #14 | Exceptional 4.7% |
| Chinese | 100.0 /100 | #15 | Exceptional 4.7% |
Demographics Similar to Immigrants from Guatemala by Disability Age 5 to 17
In terms of disability age 5 to 17, the demographic groups most similar to Immigrants from Guatemala are Pakistani (5.5%, a difference of 0.080%), Immigrants from Hungary (5.5%, a difference of 0.14%), Colombian (5.5%, a difference of 0.16%), Albanian (5.5%, a difference of 0.29%), and South American Indian (5.5%, a difference of 0.32%).
| Demographics | Rating | Rank | Disability Age 5 to 17 |
| Immigrants | Oceania | 90.8 /100 | #138 | Exceptional 5.4% |
| Belizeans | 90.8 /100 | #139 | Exceptional 5.4% |
| Immigrants | Netherlands | 90.5 /100 | #140 | Exceptional 5.4% |
| South American Indians | 89.3 /100 | #141 | Excellent 5.5% |
| Colombians | 88.0 /100 | #142 | Excellent 5.5% |
| Immigrants | Hungary | 87.9 /100 | #143 | Excellent 5.5% |
| Pakistanis | 87.3 /100 | #144 | Excellent 5.5% |
| Immigrants | Guatemala | 86.6 /100 | #145 | Excellent 5.5% |
| Albanians | 83.7 /100 | #146 | Excellent 5.5% |
| Immigrants | Albania | 83.1 /100 | #147 | Excellent 5.5% |
| Samoans | 81.9 /100 | #148 | Excellent 5.5% |
| Central Americans | 81.6 /100 | #149 | Excellent 5.5% |
| Guatemalans | 81.5 /100 | #150 | Excellent 5.5% |
| Estonians | 80.8 /100 | #151 | Excellent 5.5% |
| Ute | 80.6 /100 | #152 | Excellent 5.5% |