Indian (Asian) vs Immigrants from Guatemala Unemployment Among Ages 30 to 34 years
COMPARE
Indian (Asian)
Immigrants from Guatemala
Unemployment Among Ages 30 to 34 years
Unemployment Among Ages 30 to 34 years Comparison
Indians (Asian)
Immigrants from Guatemala
5.1%
UNEMPLOYMENT AMONG AGES 30 TO 34 YEARS
97.0/ 100
METRIC RATING
61st/ 347
METRIC RANK
6.0%
UNEMPLOYMENT AMONG AGES 30 TO 34 YEARS
0.3/ 100
METRIC RATING
248th/ 347
METRIC RANK
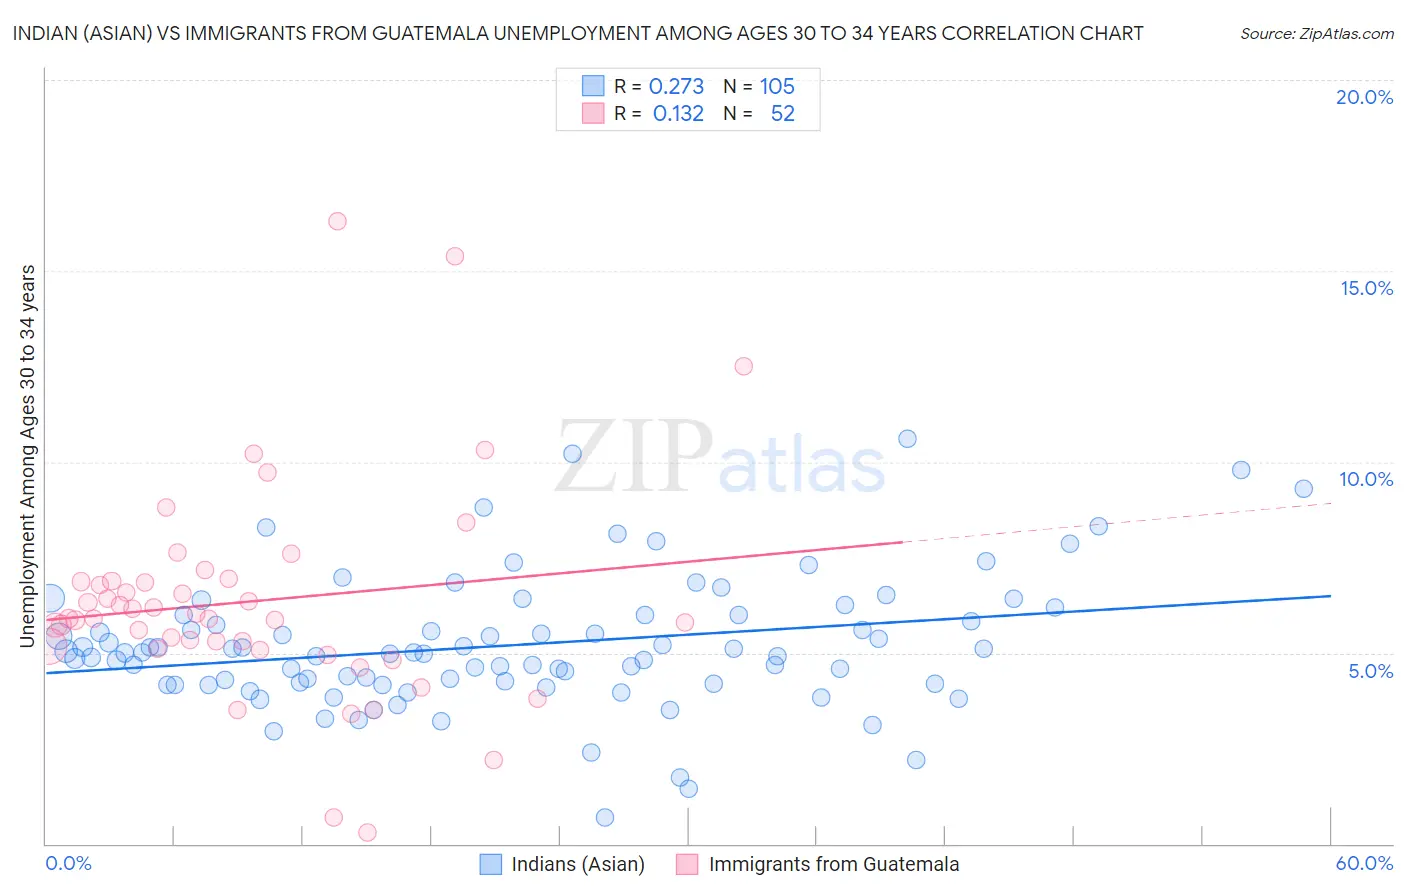
Indian (Asian) vs Immigrants from Guatemala Unemployment Among Ages 30 to 34 years Correlation Chart
The statistical analysis conducted on geographies consisting of 455,312,622 people shows a weak positive correlation between the proportion of Indians (Asian) and unemployment rate among population between the ages 30 and 34 in the United States with a correlation coefficient (R) of 0.273 and weighted average of 5.1%. Similarly, the statistical analysis conducted on geographies consisting of 359,081,964 people shows a poor positive correlation between the proportion of Immigrants from Guatemala and unemployment rate among population between the ages 30 and 34 in the United States with a correlation coefficient (R) of 0.132 and weighted average of 6.0%, a difference of 17.2%.
Unemployment Among Ages 30 to 34 years Correlation Summary
| Measurement | Indian (Asian) | Immigrants from Guatemala |
| Minimum | 0.70% | 0.30% |
| Maximum | 10.6% | 16.3% |
| Range | 9.9% | 16.0% |
| Mean | 5.2% | 6.3% |
| Median | 5.0% | 5.9% |
| Interquartile 25% (IQ1) | 4.2% | 5.1% |
| Interquartile 75% (IQ3) | 6.0% | 6.9% |
| Interquartile Range (IQR) | 1.8% | 1.7% |
| Standard Deviation (Sample) | 1.7% | 2.9% |
| Standard Deviation (Population) | 1.7% | 2.8% |
Similar Demographics by Unemployment Among Ages 30 to 34 years
Demographics Similar to Indians (Asian) by Unemployment Among Ages 30 to 34 years
In terms of unemployment among ages 30 to 34 years, the demographic groups most similar to Indians (Asian) are Immigrants from France (5.1%, a difference of 0.020%), Swedish (5.1%, a difference of 0.030%), Immigrants from Somalia (5.1%, a difference of 0.030%), Belgian (5.1%, a difference of 0.030%), and Immigrants from Eastern Asia (5.1%, a difference of 0.050%).
| Demographics | Rating | Rank | Unemployment Among Ages 30 to 34 years |
| Immigrants | Morocco | 97.9 /100 | #54 | Exceptional 5.1% |
| Chinese | 97.7 /100 | #55 | Exceptional 5.1% |
| Immigrants | Serbia | 97.4 /100 | #56 | Exceptional 5.1% |
| Immigrants | China | 97.2 /100 | #57 | Exceptional 5.1% |
| Asians | 97.2 /100 | #58 | Exceptional 5.1% |
| Swedes | 97.1 /100 | #59 | Exceptional 5.1% |
| Immigrants | Somalia | 97.1 /100 | #60 | Exceptional 5.1% |
| Indians (Asian) | 97.0 /100 | #61 | Exceptional 5.1% |
| Immigrants | France | 97.0 /100 | #62 | Exceptional 5.1% |
| Belgians | 97.0 /100 | #63 | Exceptional 5.1% |
| Immigrants | Eastern Asia | 96.9 /100 | #64 | Exceptional 5.1% |
| Immigrants | Japan | 96.8 /100 | #65 | Exceptional 5.1% |
| Immigrants | Zimbabwe | 96.7 /100 | #66 | Exceptional 5.1% |
| Burmese | 96.5 /100 | #67 | Exceptional 5.1% |
| Jordanians | 96.5 /100 | #68 | Exceptional 5.1% |
Demographics Similar to Immigrants from Guatemala by Unemployment Among Ages 30 to 34 years
In terms of unemployment among ages 30 to 34 years, the demographic groups most similar to Immigrants from Guatemala are Nigerian (6.0%, a difference of 0.0%), Honduran (6.0%, a difference of 0.0%), Ghanaian (6.0%, a difference of 0.070%), Immigrants from Honduras (6.0%, a difference of 0.10%), and Subsaharan African (6.0%, a difference of 0.25%).
| Demographics | Rating | Rank | Unemployment Among Ages 30 to 34 years |
| Immigrants | El Salvador | 0.5 /100 | #241 | Tragic 6.0% |
| Guatemalans | 0.4 /100 | #242 | Tragic 6.0% |
| Immigrants | Liberia | 0.4 /100 | #243 | Tragic 6.0% |
| Immigrants | Micronesia | 0.3 /100 | #244 | Tragic 6.0% |
| Sub-Saharan Africans | 0.3 /100 | #245 | Tragic 6.0% |
| Ghanaians | 0.3 /100 | #246 | Tragic 6.0% |
| Nigerians | 0.3 /100 | #247 | Tragic 6.0% |
| Immigrants | Guatemala | 0.3 /100 | #248 | Tragic 6.0% |
| Hondurans | 0.3 /100 | #249 | Tragic 6.0% |
| Immigrants | Honduras | 0.3 /100 | #250 | Tragic 6.0% |
| Tlingit-Haida | 0.2 /100 | #251 | Tragic 6.0% |
| Potawatomi | 0.2 /100 | #252 | Tragic 6.0% |
| Immigrants | Nonimmigrants | 0.2 /100 | #253 | Tragic 6.1% |
| Armenians | 0.1 /100 | #254 | Tragic 6.1% |
| Immigrants | Portugal | 0.1 /100 | #255 | Tragic 6.1% |