Bulgarian vs Immigrants from Guatemala Disability Age 5 to 17
COMPARE
Bulgarian
Immigrants from Guatemala
Disability Age 5 to 17
Disability Age 5 to 17 Comparison
Bulgarians
Immigrants from Guatemala
5.2%
DISABILITY AGE 5 TO 17
99.4/ 100
METRIC RATING
85th/ 347
METRIC RANK
5.5%
DISABILITY AGE 5 TO 17
86.6/ 100
METRIC RATING
145th/ 347
METRIC RANK
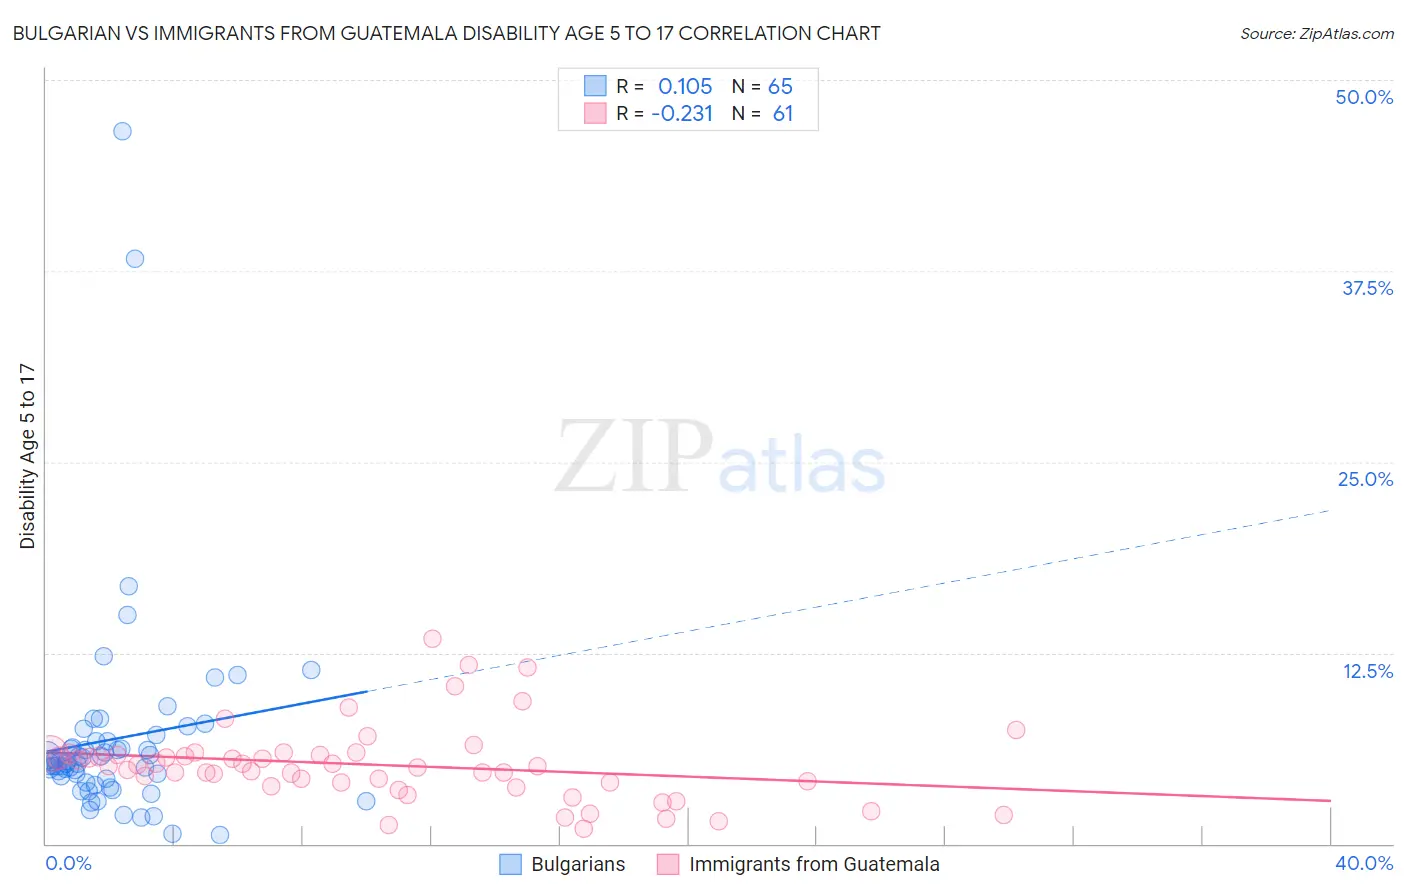
Bulgarian vs Immigrants from Guatemala Disability Age 5 to 17 Correlation Chart
The statistical analysis conducted on geographies consisting of 204,463,021 people shows a poor positive correlation between the proportion of Bulgarians and percentage of population with a disability between the ages 5 and 17 in the United States with a correlation coefficient (R) of 0.105 and weighted average of 5.2%. Similarly, the statistical analysis conducted on geographies consisting of 375,293,918 people shows a weak negative correlation between the proportion of Immigrants from Guatemala and percentage of population with a disability between the ages 5 and 17 in the United States with a correlation coefficient (R) of -0.231 and weighted average of 5.5%, a difference of 4.3%.
Disability Age 5 to 17 Correlation Summary
| Measurement | Bulgarian | Immigrants from Guatemala |
| Minimum | 0.57% | 0.98% |
| Maximum | 46.7% | 13.4% |
| Range | 46.1% | 12.4% |
| Mean | 6.9% | 5.2% |
| Median | 5.4% | 5.0% |
| Interquartile 25% (IQ1) | 4.1% | 3.9% |
| Interquartile 75% (IQ3) | 6.7% | 5.8% |
| Interquartile Range (IQR) | 2.6% | 2.0% |
| Standard Deviation (Sample) | 7.1% | 2.5% |
| Standard Deviation (Population) | 7.0% | 2.5% |
Similar Demographics by Disability Age 5 to 17
Demographics Similar to Bulgarians by Disability Age 5 to 17
In terms of disability age 5 to 17, the demographic groups most similar to Bulgarians are Immigrants from St. Vincent and the Grenadines (5.2%, a difference of 0.040%), Immigrants from Nicaragua (5.2%, a difference of 0.070%), Eastern European (5.2%, a difference of 0.080%), Immigrants from Croatia (5.2%, a difference of 0.12%), and Immigrants from Spain (5.2%, a difference of 0.12%).
| Demographics | Rating | Rank | Disability Age 5 to 17 |
| Immigrants | Cuba | 99.6 /100 | #78 | Exceptional 5.2% |
| Afghans | 99.6 /100 | #79 | Exceptional 5.2% |
| Sri Lankans | 99.6 /100 | #80 | Exceptional 5.2% |
| Native Hawaiians | 99.6 /100 | #81 | Exceptional 5.2% |
| Immigrants | Sweden | 99.5 /100 | #82 | Exceptional 5.2% |
| Immigrants | France | 99.5 /100 | #83 | Exceptional 5.2% |
| Immigrants | Nicaragua | 99.5 /100 | #84 | Exceptional 5.2% |
| Bulgarians | 99.4 /100 | #85 | Exceptional 5.2% |
| Immigrants | St. Vincent and the Grenadines | 99.4 /100 | #86 | Exceptional 5.2% |
| Eastern Europeans | 99.4 /100 | #87 | Exceptional 5.2% |
| Immigrants | Croatia | 99.4 /100 | #88 | Exceptional 5.2% |
| Immigrants | Spain | 99.4 /100 | #89 | Exceptional 5.2% |
| Immigrants | Kuwait | 99.4 /100 | #90 | Exceptional 5.3% |
| Mongolians | 99.2 /100 | #91 | Exceptional 5.3% |
| Luxembourgers | 99.2 /100 | #92 | Exceptional 5.3% |
Demographics Similar to Immigrants from Guatemala by Disability Age 5 to 17
In terms of disability age 5 to 17, the demographic groups most similar to Immigrants from Guatemala are Pakistani (5.5%, a difference of 0.080%), Immigrants from Hungary (5.5%, a difference of 0.14%), Colombian (5.5%, a difference of 0.16%), Albanian (5.5%, a difference of 0.29%), and South American Indian (5.5%, a difference of 0.32%).
| Demographics | Rating | Rank | Disability Age 5 to 17 |
| Immigrants | Oceania | 90.8 /100 | #138 | Exceptional 5.4% |
| Belizeans | 90.8 /100 | #139 | Exceptional 5.4% |
| Immigrants | Netherlands | 90.5 /100 | #140 | Exceptional 5.4% |
| South American Indians | 89.3 /100 | #141 | Excellent 5.5% |
| Colombians | 88.0 /100 | #142 | Excellent 5.5% |
| Immigrants | Hungary | 87.9 /100 | #143 | Excellent 5.5% |
| Pakistanis | 87.3 /100 | #144 | Excellent 5.5% |
| Immigrants | Guatemala | 86.6 /100 | #145 | Excellent 5.5% |
| Albanians | 83.7 /100 | #146 | Excellent 5.5% |
| Immigrants | Albania | 83.1 /100 | #147 | Excellent 5.5% |
| Samoans | 81.9 /100 | #148 | Excellent 5.5% |
| Central Americans | 81.6 /100 | #149 | Excellent 5.5% |
| Guatemalans | 81.5 /100 | #150 | Excellent 5.5% |
| Estonians | 80.8 /100 | #151 | Excellent 5.5% |
| Ute | 80.6 /100 | #152 | Excellent 5.5% |