Indian (Asian) vs Immigrants from Guatemala 11th Grade
COMPARE
Indian (Asian)
Immigrants from Guatemala
11th Grade
11th Grade Comparison
Indians (Asian)
Immigrants from Guatemala
92.5%
11TH GRADE
51.5/ 100
METRIC RATING
173rd/ 347
METRIC RANK
85.8%
11TH GRADE
0.0/ 100
METRIC RATING
342nd/ 347
METRIC RANK
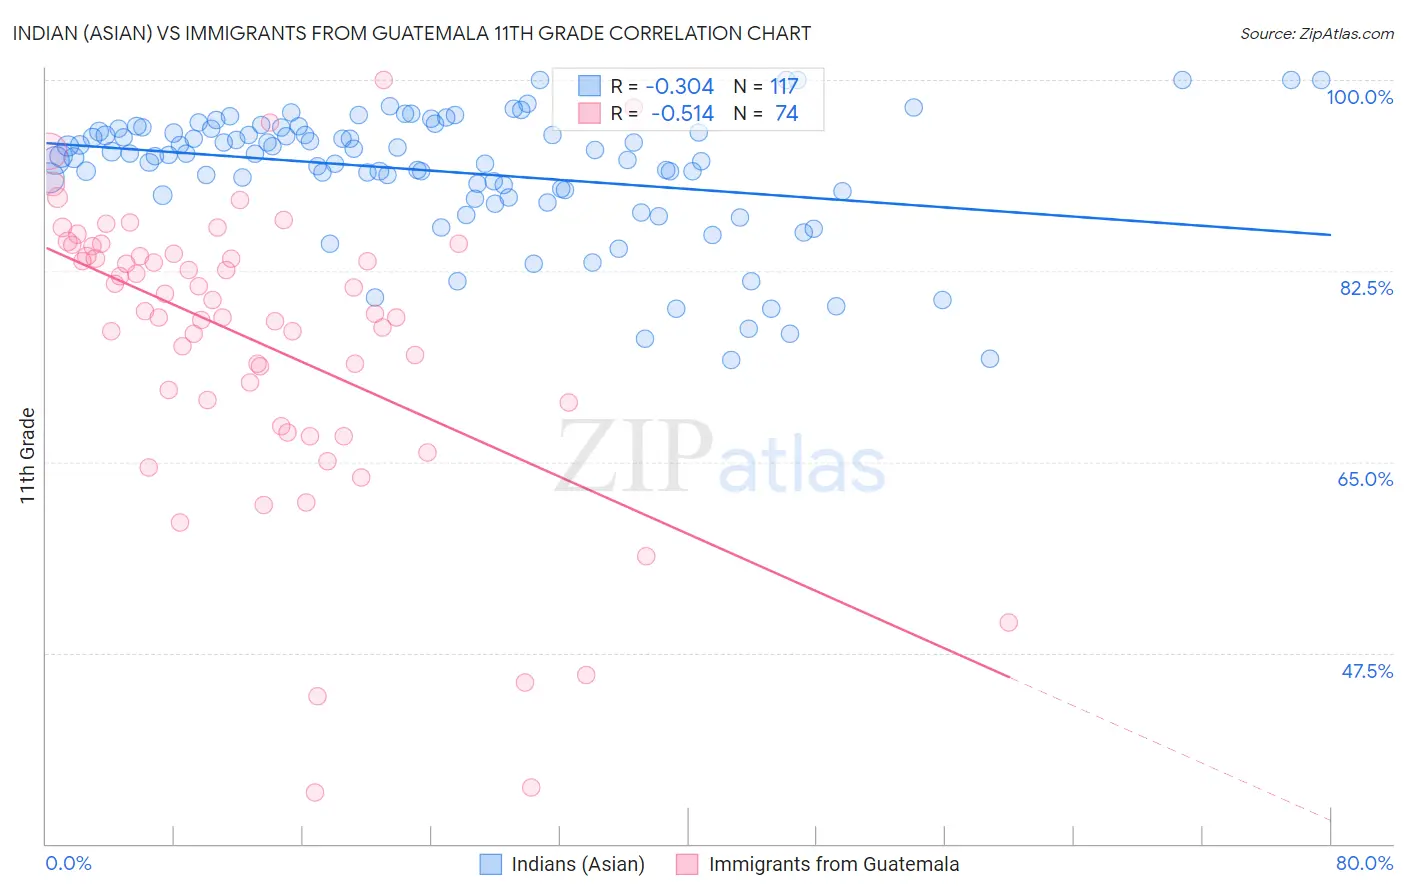
Indian (Asian) vs Immigrants from Guatemala 11th Grade Correlation Chart
The statistical analysis conducted on geographies consisting of 495,348,182 people shows a mild negative correlation between the proportion of Indians (Asian) and percentage of population with at least 11th grade education in the United States with a correlation coefficient (R) of -0.304 and weighted average of 92.5%. Similarly, the statistical analysis conducted on geographies consisting of 377,286,142 people shows a substantial negative correlation between the proportion of Immigrants from Guatemala and percentage of population with at least 11th grade education in the United States with a correlation coefficient (R) of -0.514 and weighted average of 85.8%, a difference of 7.8%.
11th Grade Correlation Summary
| Measurement | Indian (Asian) | Immigrants from Guatemala |
| Minimum | 74.4% | 34.7% |
| Maximum | 100.0% | 100.0% |
| Range | 25.6% | 65.3% |
| Mean | 91.6% | 76.0% |
| Median | 93.1% | 78.7% |
| Interquartile 25% (IQ1) | 89.6% | 70.4% |
| Interquartile 75% (IQ3) | 95.4% | 84.0% |
| Interquartile Range (IQR) | 5.8% | 13.6% |
| Standard Deviation (Sample) | 5.8% | 13.5% |
| Standard Deviation (Population) | 5.8% | 13.4% |
Similar Demographics by 11th Grade
Demographics Similar to Indians (Asian) by 11th Grade
In terms of 11th grade, the demographic groups most similar to Indians (Asian) are Immigrants from Pakistan (92.5%, a difference of 0.010%), Asian (92.5%, a difference of 0.020%), Laotian (92.6%, a difference of 0.030%), Shoshone (92.5%, a difference of 0.030%), and Spaniard (92.5%, a difference of 0.050%).
| Demographics | Rating | Rank | 11th Grade |
| Bermudans | 62.3 /100 | #166 | Good 92.6% |
| Alsatians | 60.2 /100 | #167 | Good 92.6% |
| Sierra Leoneans | 58.7 /100 | #168 | Average 92.6% |
| Immigrants | Albania | 57.8 /100 | #169 | Average 92.6% |
| Immigrants | Northern Africa | 57.3 /100 | #170 | Average 92.6% |
| Laotians | 54.4 /100 | #171 | Average 92.6% |
| Immigrants | Pakistan | 52.3 /100 | #172 | Average 92.5% |
| Indians (Asian) | 51.5 /100 | #173 | Average 92.5% |
| Asians | 50.0 /100 | #174 | Average 92.5% |
| Shoshone | 48.9 /100 | #175 | Average 92.5% |
| Spaniards | 46.9 /100 | #176 | Average 92.5% |
| Guamanians/Chamorros | 45.0 /100 | #177 | Average 92.5% |
| Sudanese | 43.4 /100 | #178 | Average 92.5% |
| Creek | 40.9 /100 | #179 | Average 92.4% |
| Inupiat | 40.7 /100 | #180 | Average 92.4% |
Demographics Similar to Immigrants from Guatemala by 11th Grade
In terms of 11th grade, the demographic groups most similar to Immigrants from Guatemala are Mexican (86.1%, a difference of 0.33%), Salvadoran (86.2%, a difference of 0.39%), Immigrants from El Salvador (85.3%, a difference of 0.61%), Guatemalan (86.4%, a difference of 0.63%), and Yakama (85.0%, a difference of 1.0%).
| Demographics | Rating | Rank | 11th Grade |
| Immigrants | Yemen | 0.0 /100 | #333 | Tragic 87.1% |
| Houma | 0.0 /100 | #334 | Tragic 87.0% |
| Central Americans | 0.0 /100 | #335 | Tragic 86.9% |
| Immigrants | Dominican Republic | 0.0 /100 | #336 | Tragic 86.9% |
| Immigrants | Honduras | 0.0 /100 | #337 | Tragic 86.9% |
| Immigrants | Latin America | 0.0 /100 | #338 | Tragic 86.8% |
| Guatemalans | 0.0 /100 | #339 | Tragic 86.4% |
| Salvadorans | 0.0 /100 | #340 | Tragic 86.2% |
| Mexicans | 0.0 /100 | #341 | Tragic 86.1% |
| Immigrants | Guatemala | 0.0 /100 | #342 | Tragic 85.8% |
| Immigrants | El Salvador | 0.0 /100 | #343 | Tragic 85.3% |
| Yakama | 0.0 /100 | #344 | Tragic 85.0% |
| Immigrants | Central America | 0.0 /100 | #345 | Tragic 84.9% |
| Spanish American Indians | 0.0 /100 | #346 | Tragic 84.7% |
| Immigrants | Mexico | 0.0 /100 | #347 | Tragic 84.5% |