Immigrants vs Trinidadian and Tobagonian Disability Age Under 5
COMPARE
Immigrants
Trinidadian and Tobagonian
Disability Age Under 5
Disability Age Under 5 Comparison
Immigrants
Trinidadians and Tobagonians
1.2%
DISABILITY AGE UNDER 5
88.0/ 100
METRIC RATING
129th/ 347
METRIC RANK
1.1%
DISABILITY AGE UNDER 5
98.6/ 100
METRIC RATING
71st/ 347
METRIC RANK
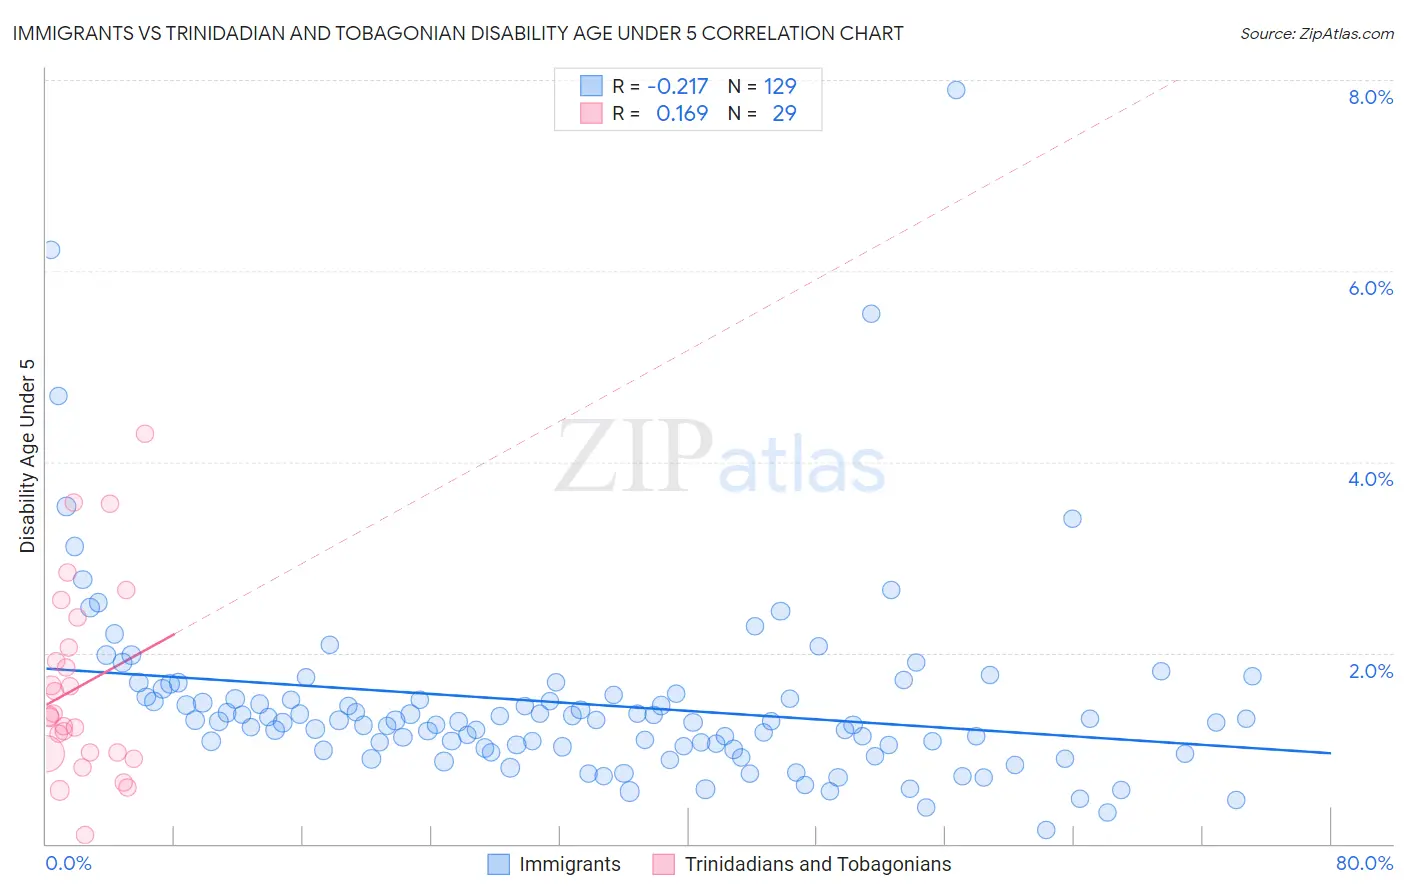
Immigrants vs Trinidadian and Tobagonian Disability Age Under 5 Correlation Chart
The statistical analysis conducted on geographies consisting of 262,190,696 people shows a weak negative correlation between the proportion of Immigrants and percentage of population with a disability under the age of 5 in the United States with a correlation coefficient (R) of -0.217 and weighted average of 1.2%. Similarly, the statistical analysis conducted on geographies consisting of 140,023,510 people shows a poor positive correlation between the proportion of Trinidadians and Tobagonians and percentage of population with a disability under the age of 5 in the United States with a correlation coefficient (R) of 0.169 and weighted average of 1.1%, a difference of 5.6%.
Disability Age Under 5 Correlation Summary
| Measurement | Immigrants | Trinidadian and Tobagonian |
| Minimum | 0.14% | 0.086% |
| Maximum | 7.9% | 4.3% |
| Range | 7.8% | 4.2% |
| Mean | 1.5% | 1.6% |
| Median | 1.3% | 1.3% |
| Interquartile 25% (IQ1) | 1.0% | 0.94% |
| Interquartile 75% (IQ3) | 1.5% | 2.2% |
| Interquartile Range (IQR) | 0.54% | 1.3% |
| Standard Deviation (Sample) | 1.0% | 1.0% |
| Standard Deviation (Population) | 1.0% | 0.98% |
Similar Demographics by Disability Age Under 5
Demographics Similar to Immigrants by Disability Age Under 5
In terms of disability age under 5, the demographic groups most similar to Immigrants are Korean (1.2%, a difference of 0.080%), Immigrants from Romania (1.2%, a difference of 0.090%), Immigrants from France (1.2%, a difference of 0.090%), Immigrants from Serbia (1.2%, a difference of 0.090%), and Immigrants from Eastern Europe (1.2%, a difference of 0.16%).
| Demographics | Rating | Rank | Disability Age Under 5 |
| Aleuts | 90.7 /100 | #122 | Exceptional 1.2% |
| Zimbabweans | 90.6 /100 | #123 | Exceptional 1.2% |
| Immigrants | Cambodia | 90.5 /100 | #124 | Exceptional 1.2% |
| Japanese | 90.3 /100 | #125 | Exceptional 1.2% |
| Central Americans | 89.7 /100 | #126 | Excellent 1.2% |
| Immigrants | Romania | 88.4 /100 | #127 | Excellent 1.2% |
| Immigrants | France | 88.4 /100 | #128 | Excellent 1.2% |
| Immigrants | Immigrants | 88.0 /100 | #129 | Excellent 1.2% |
| Koreans | 87.7 /100 | #130 | Excellent 1.2% |
| Immigrants | Serbia | 87.6 /100 | #131 | Excellent 1.2% |
| Immigrants | Eastern Europe | 87.3 /100 | #132 | Excellent 1.2% |
| Immigrants | Spain | 86.5 /100 | #133 | Excellent 1.2% |
| Argentineans | 85.7 /100 | #134 | Excellent 1.2% |
| Fijians | 84.7 /100 | #135 | Excellent 1.2% |
| Moroccans | 83.6 /100 | #136 | Excellent 1.2% |
Demographics Similar to Trinidadians and Tobagonians by Disability Age Under 5
In terms of disability age under 5, the demographic groups most similar to Trinidadians and Tobagonians are Immigrants from Ecuador (1.1%, a difference of 0.060%), Israeli (1.1%, a difference of 0.15%), Burmese (1.1%, a difference of 0.16%), South African (1.1%, a difference of 0.17%), and Immigrants from Belize (1.1%, a difference of 0.21%).
| Demographics | Rating | Rank | Disability Age Under 5 |
| Egyptians | 98.9 /100 | #64 | Exceptional 1.1% |
| Immigrants | Korea | 98.8 /100 | #65 | Exceptional 1.1% |
| Immigrants | Indonesia | 98.7 /100 | #66 | Exceptional 1.1% |
| Immigrants | Belize | 98.7 /100 | #67 | Exceptional 1.1% |
| South Africans | 98.7 /100 | #68 | Exceptional 1.1% |
| Israelis | 98.7 /100 | #69 | Exceptional 1.1% |
| Immigrants | Ecuador | 98.6 /100 | #70 | Exceptional 1.1% |
| Trinidadians and Tobagonians | 98.6 /100 | #71 | Exceptional 1.1% |
| Burmese | 98.5 /100 | #72 | Exceptional 1.1% |
| Immigrants | Sri Lanka | 98.5 /100 | #73 | Exceptional 1.1% |
| Jordanians | 98.5 /100 | #74 | Exceptional 1.1% |
| Immigrants | Pakistan | 98.4 /100 | #75 | Exceptional 1.1% |
| Immigrants | Burma/Myanmar | 98.2 /100 | #76 | Exceptional 1.1% |
| Immigrants | Denmark | 98.1 /100 | #77 | Exceptional 1.1% |
| West Indians | 98.0 /100 | #78 | Exceptional 1.1% |