Immigrants vs Soviet Union Associate's Degree
COMPARE
Immigrants
Soviet Union
Associate's Degree
Associate's Degree Comparison
Immigrants
Soviet Union
44.5%
ASSOCIATE'S DEGREE
10.5/ 100
METRIC RATING
217th/ 347
METRIC RANK
55.1%
ASSOCIATE'S DEGREE
100.0/ 100
METRIC RATING
16th/ 347
METRIC RANK
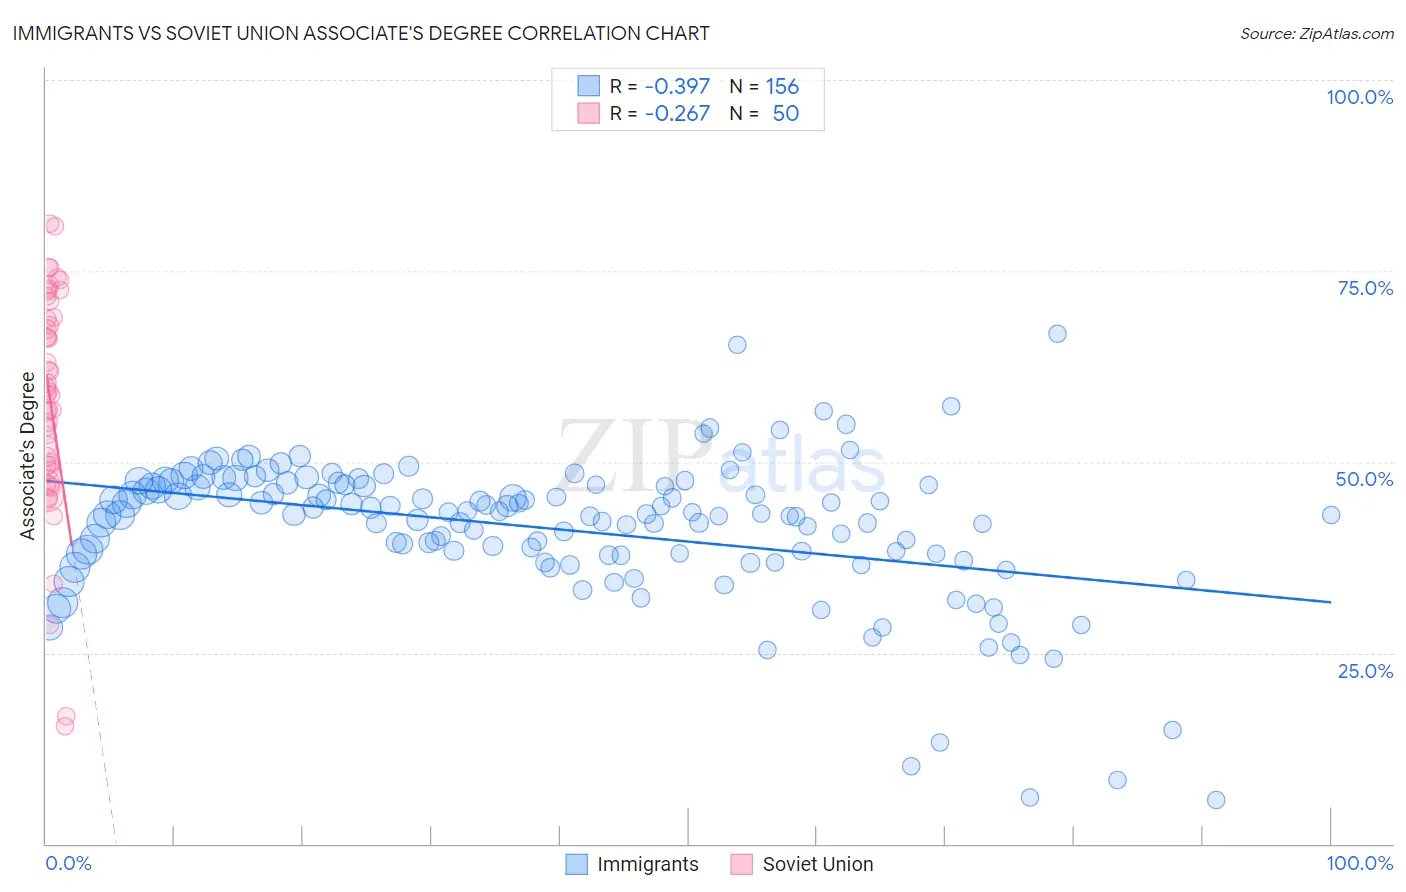
Immigrants vs Soviet Union Associate's Degree Correlation Chart
The statistical analysis conducted on geographies consisting of 577,638,441 people shows a mild negative correlation between the proportion of Immigrants and percentage of population with at least associate's degree education in the United States with a correlation coefficient (R) of -0.397 and weighted average of 44.5%. Similarly, the statistical analysis conducted on geographies consisting of 43,514,626 people shows a weak negative correlation between the proportion of Soviet Union and percentage of population with at least associate's degree education in the United States with a correlation coefficient (R) of -0.267 and weighted average of 55.1%, a difference of 23.9%.
Associate's Degree Correlation Summary
| Measurement | Immigrants | Soviet Union |
| Minimum | 5.7% | 15.5% |
| Maximum | 66.8% | 81.2% |
| Range | 61.1% | 65.7% |
| Mean | 41.2% | 58.0% |
| Median | 43.1% | 59.1% |
| Interquartile 25% (IQ1) | 37.8% | 49.5% |
| Interquartile 75% (IQ3) | 46.9% | 68.9% |
| Interquartile Range (IQR) | 9.1% | 19.4% |
| Standard Deviation (Sample) | 9.6% | 14.7% |
| Standard Deviation (Population) | 9.5% | 14.5% |
Similar Demographics by Associate's Degree
Demographics Similar to Immigrants by Associate's Degree
In terms of associate's degree, the demographic groups most similar to Immigrants are Immigrants from Nigeria (44.6%, a difference of 0.19%), Spanish (44.4%, a difference of 0.25%), Immigrants from Panama (44.7%, a difference of 0.37%), Immigrants from Middle Africa (44.7%, a difference of 0.42%), and Immigrants from Ghana (44.8%, a difference of 0.68%).
| Demographics | Rating | Rank | Associate's Degree |
| Immigrants | Philippines | 16.7 /100 | #210 | Poor 45.0% |
| Immigrants | Zaire | 16.6 /100 | #211 | Poor 45.0% |
| French Canadians | 15.0 /100 | #212 | Poor 44.9% |
| Immigrants | Ghana | 14.2 /100 | #213 | Poor 44.8% |
| Immigrants | Middle Africa | 12.7 /100 | #214 | Poor 44.7% |
| Immigrants | Panama | 12.4 /100 | #215 | Poor 44.7% |
| Immigrants | Nigeria | 11.4 /100 | #216 | Poor 44.6% |
| Immigrants | Immigrants | 10.5 /100 | #217 | Poor 44.5% |
| Spanish | 9.4 /100 | #218 | Tragic 44.4% |
| Whites/Caucasians | 7.5 /100 | #219 | Tragic 44.2% |
| Portuguese | 7.2 /100 | #220 | Tragic 44.1% |
| Immigrants | Western Africa | 6.6 /100 | #221 | Tragic 44.1% |
| Barbadians | 5.8 /100 | #222 | Tragic 43.9% |
| Sub-Saharan Africans | 5.5 /100 | #223 | Tragic 43.9% |
| West Indians | 5.2 /100 | #224 | Tragic 43.8% |
Demographics Similar to Soviet Union by Associate's Degree
In terms of associate's degree, the demographic groups most similar to Soviet Union are Eastern European (55.0%, a difference of 0.14%), Immigrants from Eastern Asia (55.4%, a difference of 0.47%), Immigrants from Hong Kong (55.4%, a difference of 0.50%), Indian (Asian) (54.8%, a difference of 0.61%), and Immigrants from China (55.5%, a difference of 0.65%).
| Demographics | Rating | Rank | Associate's Degree |
| Immigrants | Israel | 100.0 /100 | #9 | Exceptional 56.8% |
| Cypriots | 100.0 /100 | #10 | Exceptional 56.4% |
| Immigrants | Australia | 100.0 /100 | #11 | Exceptional 55.8% |
| Immigrants | South Central Asia | 100.0 /100 | #12 | Exceptional 55.7% |
| Immigrants | China | 100.0 /100 | #13 | Exceptional 55.5% |
| Immigrants | Hong Kong | 100.0 /100 | #14 | Exceptional 55.4% |
| Immigrants | Eastern Asia | 100.0 /100 | #15 | Exceptional 55.4% |
| Soviet Union | 100.0 /100 | #16 | Exceptional 55.1% |
| Eastern Europeans | 100.0 /100 | #17 | Exceptional 55.0% |
| Indians (Asian) | 100.0 /100 | #18 | Exceptional 54.8% |
| Immigrants | Ireland | 100.0 /100 | #19 | Exceptional 54.7% |
| Cambodians | 100.0 /100 | #20 | Exceptional 54.6% |
| Immigrants | Sweden | 100.0 /100 | #21 | Exceptional 54.6% |
| Immigrants | Japan | 100.0 /100 | #22 | Exceptional 54.6% |
| Burmese | 100.0 /100 | #23 | Exceptional 54.6% |