Immigrants vs Scottish Cognitive Disability
COMPARE
Immigrants
Scottish
Cognitive Disability
Cognitive Disability Comparison
Immigrants
Scottish
17.2%
COGNITIVE DISABILITY
62.5/ 100
METRIC RATING
168th/ 347
METRIC RANK
16.9%
COGNITIVE DISABILITY
95.0/ 100
METRIC RATING
120th/ 347
METRIC RANK
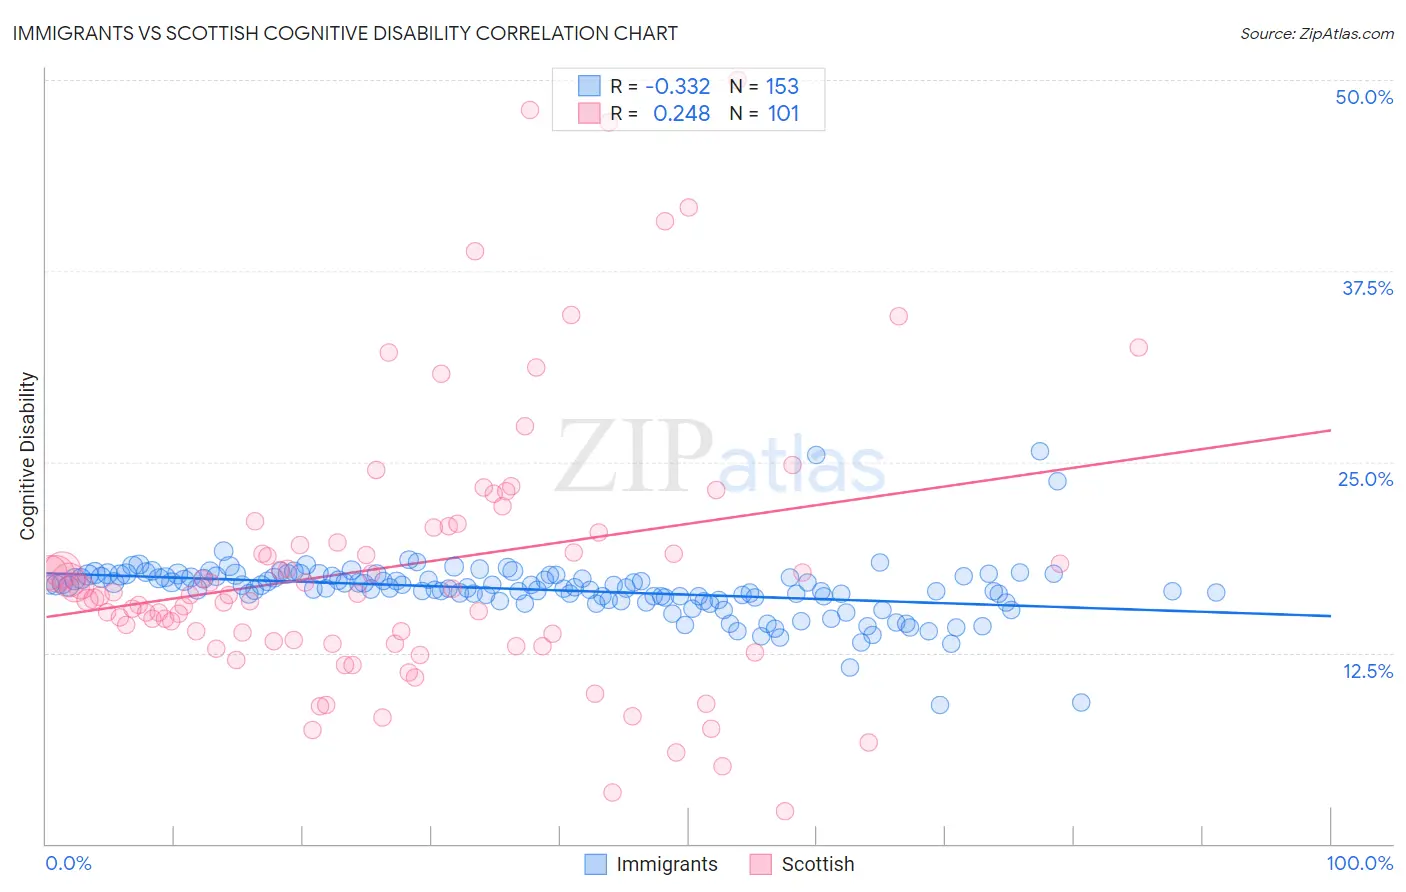
Immigrants vs Scottish Cognitive Disability Correlation Chart
The statistical analysis conducted on geographies consisting of 577,580,100 people shows a mild negative correlation between the proportion of Immigrants and percentage of population with cognitive disability in the United States with a correlation coefficient (R) of -0.332 and weighted average of 17.2%. Similarly, the statistical analysis conducted on geographies consisting of 566,987,666 people shows a weak positive correlation between the proportion of Scottish and percentage of population with cognitive disability in the United States with a correlation coefficient (R) of 0.248 and weighted average of 16.9%, a difference of 1.8%.
Cognitive Disability Correlation Summary
| Measurement | Immigrants | Scottish |
| Minimum | 9.1% | 2.1% |
| Maximum | 25.7% | 50.0% |
| Range | 16.6% | 47.9% |
| Mean | 16.6% | 18.2% |
| Median | 16.8% | 16.3% |
| Interquartile 25% (IQ1) | 16.0% | 13.2% |
| Interquartile 75% (IQ3) | 17.6% | 20.5% |
| Interquartile Range (IQR) | 1.5% | 7.3% |
| Standard Deviation (Sample) | 1.9% | 9.1% |
| Standard Deviation (Population) | 1.9% | 9.0% |
Similar Demographics by Cognitive Disability
Demographics Similar to Immigrants by Cognitive Disability
In terms of cognitive disability, the demographic groups most similar to Immigrants are Immigrants from Portugal (17.2%, a difference of 0.020%), Immigrants from Syria (17.2%, a difference of 0.030%), Immigrants from Ecuador (17.2%, a difference of 0.060%), Immigrants from Albania (17.2%, a difference of 0.070%), and Ecuadorian (17.2%, a difference of 0.090%).
| Demographics | Rating | Rank | Cognitive Disability |
| Americans | 72.2 /100 | #161 | Good 17.2% |
| Yugoslavians | 71.6 /100 | #162 | Good 17.2% |
| Immigrants | Switzerland | 71.5 /100 | #163 | Good 17.2% |
| Armenians | 70.1 /100 | #164 | Good 17.2% |
| Immigrants | Albania | 64.9 /100 | #165 | Good 17.2% |
| Immigrants | Ecuador | 64.4 /100 | #166 | Good 17.2% |
| Immigrants | Syria | 63.5 /100 | #167 | Good 17.2% |
| Immigrants | Immigrants | 62.5 /100 | #168 | Good 17.2% |
| Immigrants | Portugal | 61.8 /100 | #169 | Good 17.2% |
| Ecuadorians | 59.6 /100 | #170 | Average 17.2% |
| Tlingit-Haida | 59.4 /100 | #171 | Average 17.2% |
| Immigrants | Turkey | 56.7 /100 | #172 | Average 17.2% |
| Immigrants | Northern Africa | 50.2 /100 | #173 | Average 17.3% |
| Laotians | 50.0 /100 | #174 | Average 17.3% |
| Tsimshian | 49.8 /100 | #175 | Average 17.3% |
Demographics Similar to Scottish by Cognitive Disability
In terms of cognitive disability, the demographic groups most similar to Scottish are Immigrants from China (16.9%, a difference of 0.020%), Immigrants from Western Europe (16.9%, a difference of 0.030%), Portuguese (16.9%, a difference of 0.040%), Turkish (16.9%, a difference of 0.070%), and South African (16.9%, a difference of 0.080%).
| Demographics | Rating | Rank | Cognitive Disability |
| Immigrants | Sri Lanka | 97.1 /100 | #113 | Exceptional 16.8% |
| Koreans | 97.1 /100 | #114 | Exceptional 16.8% |
| Yup'ik | 96.9 /100 | #115 | Exceptional 16.9% |
| Inupiat | 96.5 /100 | #116 | Exceptional 16.9% |
| Immigrants | Japan | 96.2 /100 | #117 | Exceptional 16.9% |
| Immigrants | Denmark | 96.2 /100 | #118 | Exceptional 16.9% |
| South Africans | 95.5 /100 | #119 | Exceptional 16.9% |
| Scottish | 95.0 /100 | #120 | Exceptional 16.9% |
| Immigrants | China | 94.9 /100 | #121 | Exceptional 16.9% |
| Immigrants | Western Europe | 94.8 /100 | #122 | Exceptional 16.9% |
| Portuguese | 94.7 /100 | #123 | Exceptional 16.9% |
| Turks | 94.5 /100 | #124 | Exceptional 16.9% |
| Scandinavians | 94.1 /100 | #125 | Exceptional 16.9% |
| Europeans | 93.4 /100 | #126 | Exceptional 17.0% |
| Immigrants | Costa Rica | 93.1 /100 | #127 | Exceptional 17.0% |