Immigrants from Uruguay vs Scottish Cognitive Disability
COMPARE
Immigrants from Uruguay
Scottish
Cognitive Disability
Cognitive Disability Comparison
Immigrants from Uruguay
Scottish
17.0%
COGNITIVE DISABILITY
92.9/ 100
METRIC RATING
129th/ 347
METRIC RANK
16.9%
COGNITIVE DISABILITY
95.0/ 100
METRIC RATING
120th/ 347
METRIC RANK
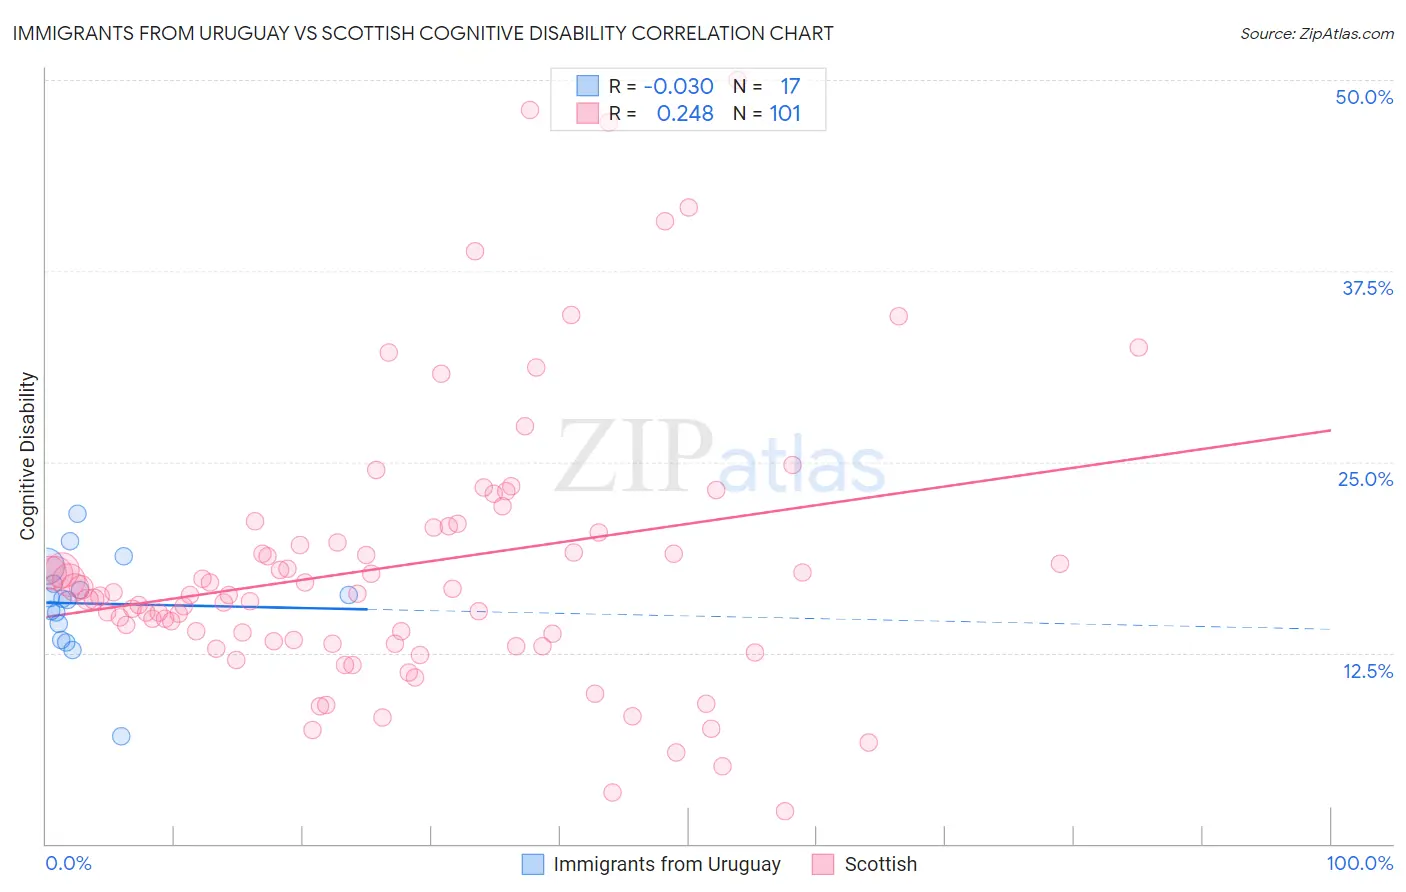
Immigrants from Uruguay vs Scottish Cognitive Disability Correlation Chart
The statistical analysis conducted on geographies consisting of 133,256,548 people shows no correlation between the proportion of Immigrants from Uruguay and percentage of population with cognitive disability in the United States with a correlation coefficient (R) of -0.030 and weighted average of 17.0%. Similarly, the statistical analysis conducted on geographies consisting of 566,987,666 people shows a weak positive correlation between the proportion of Scottish and percentage of population with cognitive disability in the United States with a correlation coefficient (R) of 0.248 and weighted average of 16.9%, a difference of 0.27%.
Cognitive Disability Correlation Summary
| Measurement | Immigrants from Uruguay | Scottish |
| Minimum | 7.0% | 2.1% |
| Maximum | 21.6% | 50.0% |
| Range | 14.5% | 47.9% |
| Mean | 15.7% | 18.2% |
| Median | 16.0% | 16.3% |
| Interquartile 25% (IQ1) | 13.8% | 13.2% |
| Interquartile 75% (IQ3) | 17.6% | 20.5% |
| Interquartile Range (IQR) | 3.8% | 7.3% |
| Standard Deviation (Sample) | 3.2% | 9.1% |
| Standard Deviation (Population) | 3.2% | 9.0% |
Demographics Similar to Immigrants from Uruguay and Scottish by Cognitive Disability
In terms of cognitive disability, the demographic groups most similar to Immigrants from Uruguay are Nicaraguan (17.0%, a difference of 0.010%), Immigrants from Costa Rica (17.0%, a difference of 0.020%), European (17.0%, a difference of 0.060%), Immigrants from Vietnam (17.0%, a difference of 0.060%), and Immigrants from Germany (17.0%, a difference of 0.080%). Similarly, the demographic groups most similar to Scottish are Immigrants from China (16.9%, a difference of 0.020%), Immigrants from Western Europe (16.9%, a difference of 0.030%), Portuguese (16.9%, a difference of 0.040%), Turkish (16.9%, a difference of 0.070%), and South African (16.9%, a difference of 0.080%).
| Demographics | Rating | Rank | Cognitive Disability |
| Koreans | 97.1 /100 | #114 | Exceptional 16.8% |
| Yup'ik | 96.9 /100 | #115 | Exceptional 16.9% |
| Inupiat | 96.5 /100 | #116 | Exceptional 16.9% |
| Immigrants | Japan | 96.2 /100 | #117 | Exceptional 16.9% |
| Immigrants | Denmark | 96.2 /100 | #118 | Exceptional 16.9% |
| South Africans | 95.5 /100 | #119 | Exceptional 16.9% |
| Scottish | 95.0 /100 | #120 | Exceptional 16.9% |
| Immigrants | China | 94.9 /100 | #121 | Exceptional 16.9% |
| Immigrants | Western Europe | 94.8 /100 | #122 | Exceptional 16.9% |
| Portuguese | 94.7 /100 | #123 | Exceptional 16.9% |
| Turks | 94.5 /100 | #124 | Exceptional 16.9% |
| Scandinavians | 94.1 /100 | #125 | Exceptional 16.9% |
| Europeans | 93.4 /100 | #126 | Exceptional 17.0% |
| Immigrants | Costa Rica | 93.1 /100 | #127 | Exceptional 17.0% |
| Nicaraguans | 93.0 /100 | #128 | Exceptional 17.0% |
| Immigrants | Uruguay | 92.9 /100 | #129 | Exceptional 17.0% |
| Immigrants | Vietnam | 92.4 /100 | #130 | Exceptional 17.0% |
| Immigrants | Germany | 92.1 /100 | #131 | Exceptional 17.0% |
| Whites/Caucasians | 92.1 /100 | #132 | Exceptional 17.0% |
| Immigrants | Jordan | 91.9 /100 | #133 | Exceptional 17.0% |
| Immigrants | Chile | 91.7 /100 | #134 | Exceptional 17.0% |