Immigrants from Sri Lanka vs Scottish Cognitive Disability
COMPARE
Immigrants from Sri Lanka
Scottish
Cognitive Disability
Cognitive Disability Comparison
Immigrants from Sri Lanka
Scottish
16.8%
COGNITIVE DISABILITY
97.1/ 100
METRIC RATING
113th/ 347
METRIC RANK
16.9%
COGNITIVE DISABILITY
95.0/ 100
METRIC RATING
120th/ 347
METRIC RANK
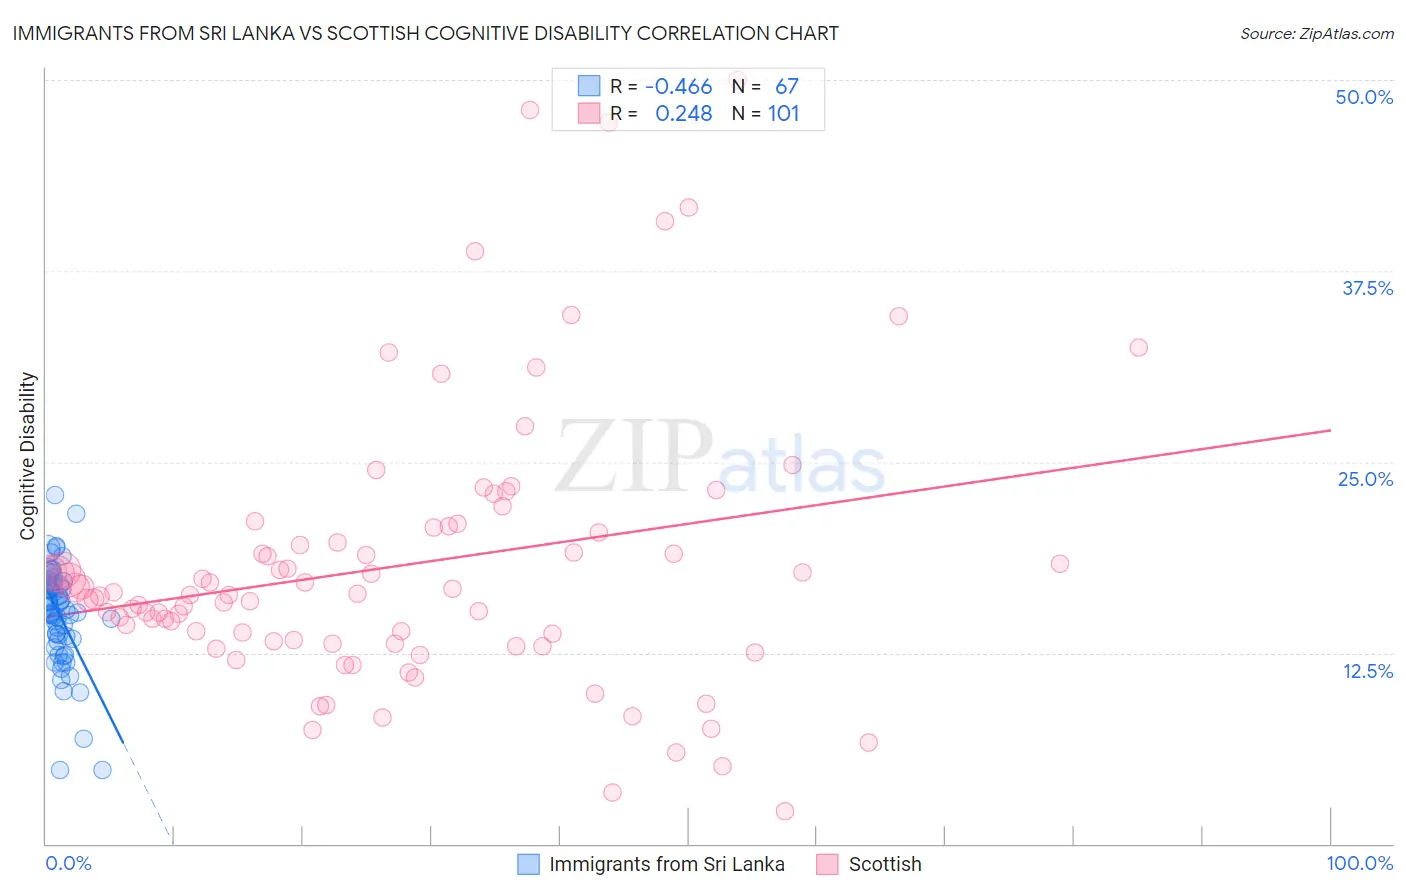
Immigrants from Sri Lanka vs Scottish Cognitive Disability Correlation Chart
The statistical analysis conducted on geographies consisting of 149,697,032 people shows a moderate negative correlation between the proportion of Immigrants from Sri Lanka and percentage of population with cognitive disability in the United States with a correlation coefficient (R) of -0.466 and weighted average of 16.8%. Similarly, the statistical analysis conducted on geographies consisting of 566,987,666 people shows a weak positive correlation between the proportion of Scottish and percentage of population with cognitive disability in the United States with a correlation coefficient (R) of 0.248 and weighted average of 16.9%, a difference of 0.43%.
Cognitive Disability Correlation Summary
| Measurement | Immigrants from Sri Lanka | Scottish |
| Minimum | 4.8% | 2.1% |
| Maximum | 22.9% | 50.0% |
| Range | 18.1% | 47.9% |
| Mean | 15.0% | 18.2% |
| Median | 15.3% | 16.3% |
| Interquartile 25% (IQ1) | 13.4% | 13.2% |
| Interquartile 75% (IQ3) | 17.0% | 20.5% |
| Interquartile Range (IQR) | 3.6% | 7.3% |
| Standard Deviation (Sample) | 3.3% | 9.1% |
| Standard Deviation (Population) | 3.3% | 9.0% |
Demographics Similar to Immigrants from Sri Lanka and Scottish by Cognitive Disability
In terms of cognitive disability, the demographic groups most similar to Immigrants from Sri Lanka are Indian (Asian) (16.8%, a difference of 0.0%), Korean (16.8%, a difference of 0.0%), Uruguayan (16.8%, a difference of 0.030%), Arapaho (16.8%, a difference of 0.040%), and Albanian (16.8%, a difference of 0.050%). Similarly, the demographic groups most similar to Scottish are Immigrants from China (16.9%, a difference of 0.020%), Immigrants from Western Europe (16.9%, a difference of 0.030%), Portuguese (16.9%, a difference of 0.040%), Turkish (16.9%, a difference of 0.070%), and South African (16.9%, a difference of 0.080%).
| Demographics | Rating | Rank | Cognitive Disability |
| Northern Europeans | 97.8 /100 | #106 | Exceptional 16.8% |
| Immigrants | Nicaragua | 97.8 /100 | #107 | Exceptional 16.8% |
| Canadians | 97.5 /100 | #108 | Exceptional 16.8% |
| Albanians | 97.3 /100 | #109 | Exceptional 16.8% |
| Arapaho | 97.3 /100 | #110 | Exceptional 16.8% |
| Uruguayans | 97.2 /100 | #111 | Exceptional 16.8% |
| Indians (Asian) | 97.2 /100 | #112 | Exceptional 16.8% |
| Immigrants | Sri Lanka | 97.1 /100 | #113 | Exceptional 16.8% |
| Koreans | 97.1 /100 | #114 | Exceptional 16.8% |
| Yup'ik | 96.9 /100 | #115 | Exceptional 16.9% |
| Inupiat | 96.5 /100 | #116 | Exceptional 16.9% |
| Immigrants | Japan | 96.2 /100 | #117 | Exceptional 16.9% |
| Immigrants | Denmark | 96.2 /100 | #118 | Exceptional 16.9% |
| South Africans | 95.5 /100 | #119 | Exceptional 16.9% |
| Scottish | 95.0 /100 | #120 | Exceptional 16.9% |
| Immigrants | China | 94.9 /100 | #121 | Exceptional 16.9% |
| Immigrants | Western Europe | 94.8 /100 | #122 | Exceptional 16.9% |
| Portuguese | 94.7 /100 | #123 | Exceptional 16.9% |
| Turks | 94.5 /100 | #124 | Exceptional 16.9% |
| Scandinavians | 94.1 /100 | #125 | Exceptional 16.9% |
| Europeans | 93.4 /100 | #126 | Exceptional 17.0% |