Guyanese vs Scottish Cognitive Disability
COMPARE
Guyanese
Scottish
Cognitive Disability
Cognitive Disability Comparison
Guyanese
Scottish
17.5%
COGNITIVE DISABILITY
17.5/ 100
METRIC RATING
196th/ 347
METRIC RANK
16.9%
COGNITIVE DISABILITY
95.0/ 100
METRIC RATING
120th/ 347
METRIC RANK
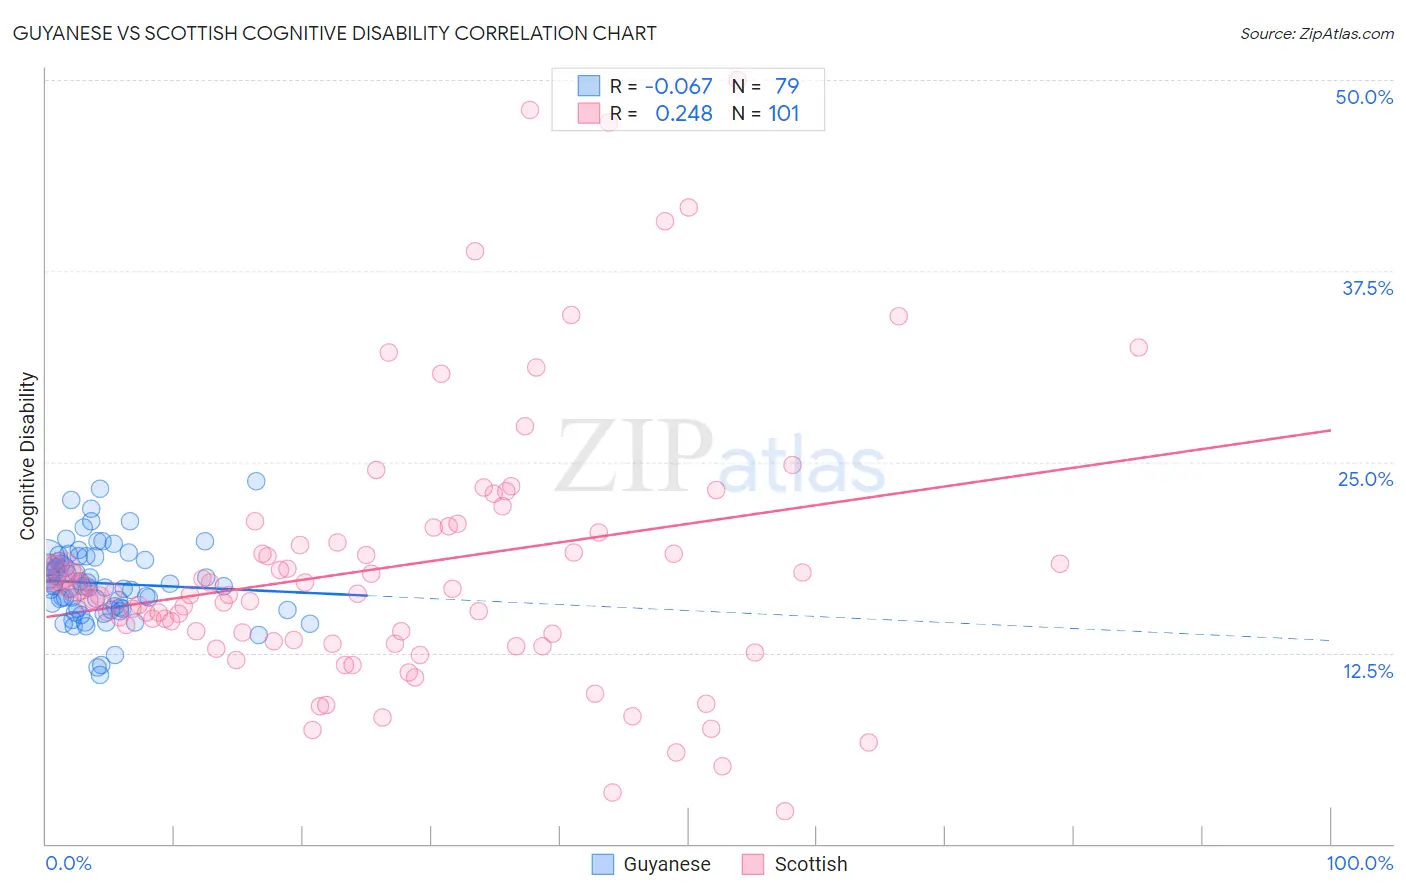
Guyanese vs Scottish Cognitive Disability Correlation Chart
The statistical analysis conducted on geographies consisting of 176,911,686 people shows a slight negative correlation between the proportion of Guyanese and percentage of population with cognitive disability in the United States with a correlation coefficient (R) of -0.067 and weighted average of 17.5%. Similarly, the statistical analysis conducted on geographies consisting of 566,987,666 people shows a weak positive correlation between the proportion of Scottish and percentage of population with cognitive disability in the United States with a correlation coefficient (R) of 0.248 and weighted average of 16.9%, a difference of 3.3%.
Cognitive Disability Correlation Summary
| Measurement | Guyanese | Scottish |
| Minimum | 11.0% | 2.1% |
| Maximum | 23.7% | 50.0% |
| Range | 12.7% | 47.9% |
| Mean | 17.1% | 18.2% |
| Median | 16.9% | 16.3% |
| Interquartile 25% (IQ1) | 15.4% | 13.2% |
| Interquartile 75% (IQ3) | 18.7% | 20.5% |
| Interquartile Range (IQR) | 3.3% | 7.3% |
| Standard Deviation (Sample) | 2.5% | 9.1% |
| Standard Deviation (Population) | 2.5% | 9.0% |
Similar Demographics by Cognitive Disability
Demographics Similar to Guyanese by Cognitive Disability
In terms of cognitive disability, the demographic groups most similar to Guyanese are Immigrants from Afghanistan (17.5%, a difference of 0.040%), Immigrants from Panama (17.5%, a difference of 0.14%), New Zealander (17.4%, a difference of 0.16%), Immigrants from Singapore (17.5%, a difference of 0.17%), and Haitian (17.5%, a difference of 0.18%).
| Demographics | Rating | Rank | Cognitive Disability |
| Immigrants | Western Asia | 29.5 /100 | #189 | Fair 17.4% |
| Immigrants | Spain | 27.7 /100 | #190 | Fair 17.4% |
| Immigrants | Nonimmigrants | 27.4 /100 | #191 | Fair 17.4% |
| Immigrants | Haiti | 27.1 /100 | #192 | Fair 17.4% |
| Delaware | 25.6 /100 | #193 | Fair 17.4% |
| Immigrants | Bosnia and Herzegovina | 22.0 /100 | #194 | Fair 17.4% |
| New Zealanders | 21.1 /100 | #195 | Fair 17.4% |
| Guyanese | 17.5 /100 | #196 | Poor 17.5% |
| Immigrants | Afghanistan | 16.7 /100 | #197 | Poor 17.5% |
| Immigrants | Panama | 14.8 /100 | #198 | Poor 17.5% |
| Immigrants | Singapore | 14.3 /100 | #199 | Poor 17.5% |
| Haitians | 14.1 /100 | #200 | Poor 17.5% |
| South American Indians | 13.0 /100 | #201 | Poor 17.5% |
| Immigrants | Morocco | 12.0 /100 | #202 | Poor 17.5% |
| Immigrants | Caribbean | 11.0 /100 | #203 | Poor 17.5% |
Demographics Similar to Scottish by Cognitive Disability
In terms of cognitive disability, the demographic groups most similar to Scottish are Immigrants from China (16.9%, a difference of 0.020%), Immigrants from Western Europe (16.9%, a difference of 0.030%), Portuguese (16.9%, a difference of 0.040%), Turkish (16.9%, a difference of 0.070%), and South African (16.9%, a difference of 0.080%).
| Demographics | Rating | Rank | Cognitive Disability |
| Immigrants | Sri Lanka | 97.1 /100 | #113 | Exceptional 16.8% |
| Koreans | 97.1 /100 | #114 | Exceptional 16.8% |
| Yup'ik | 96.9 /100 | #115 | Exceptional 16.9% |
| Inupiat | 96.5 /100 | #116 | Exceptional 16.9% |
| Immigrants | Japan | 96.2 /100 | #117 | Exceptional 16.9% |
| Immigrants | Denmark | 96.2 /100 | #118 | Exceptional 16.9% |
| South Africans | 95.5 /100 | #119 | Exceptional 16.9% |
| Scottish | 95.0 /100 | #120 | Exceptional 16.9% |
| Immigrants | China | 94.9 /100 | #121 | Exceptional 16.9% |
| Immigrants | Western Europe | 94.8 /100 | #122 | Exceptional 16.9% |
| Portuguese | 94.7 /100 | #123 | Exceptional 16.9% |
| Turks | 94.5 /100 | #124 | Exceptional 16.9% |
| Scandinavians | 94.1 /100 | #125 | Exceptional 16.9% |
| Europeans | 93.4 /100 | #126 | Exceptional 17.0% |
| Immigrants | Costa Rica | 93.1 /100 | #127 | Exceptional 17.0% |