Immigrants vs Central American Indian Cognitive Disability
COMPARE
Immigrants
Central American Indian
Cognitive Disability
Cognitive Disability Comparison
Immigrants
Central American Indians
17.2%
COGNITIVE DISABILITY
62.5/ 100
METRIC RATING
168th/ 347
METRIC RANK
18.2%
COGNITIVE DISABILITY
0.1/ 100
METRIC RATING
293rd/ 347
METRIC RANK
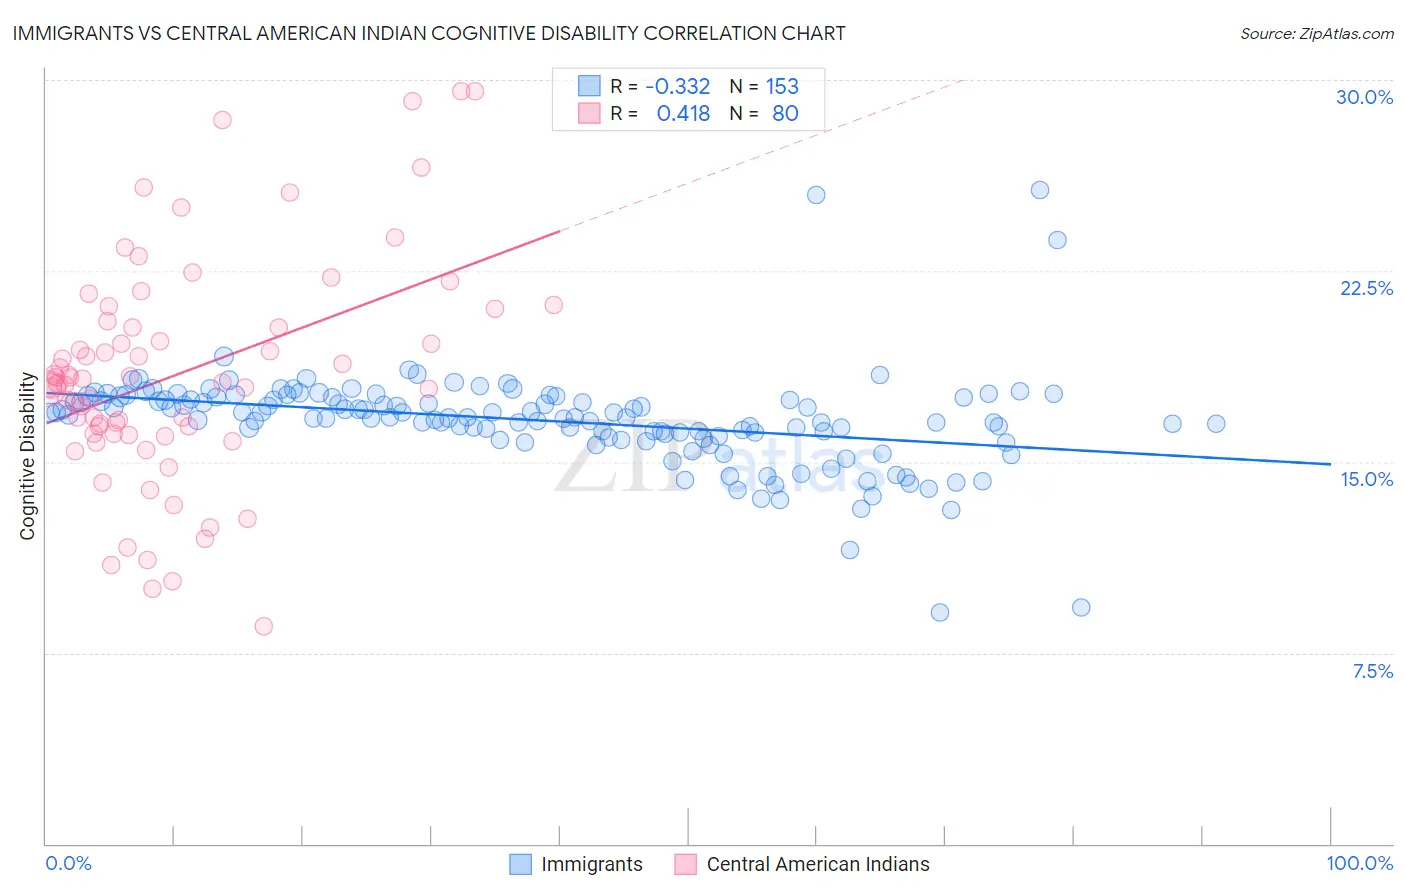
Immigrants vs Central American Indian Cognitive Disability Correlation Chart
The statistical analysis conducted on geographies consisting of 577,580,100 people shows a mild negative correlation between the proportion of Immigrants and percentage of population with cognitive disability in the United States with a correlation coefficient (R) of -0.332 and weighted average of 17.2%. Similarly, the statistical analysis conducted on geographies consisting of 326,115,408 people shows a moderate positive correlation between the proportion of Central American Indians and percentage of population with cognitive disability in the United States with a correlation coefficient (R) of 0.418 and weighted average of 18.2%, a difference of 5.6%.
Cognitive Disability Correlation Summary
| Measurement | Immigrants | Central American Indian |
| Minimum | 9.1% | 8.5% |
| Maximum | 25.7% | 29.6% |
| Range | 16.6% | 21.0% |
| Mean | 16.6% | 18.4% |
| Median | 16.8% | 18.1% |
| Interquartile 25% (IQ1) | 16.0% | 16.1% |
| Interquartile 75% (IQ3) | 17.6% | 20.4% |
| Interquartile Range (IQR) | 1.5% | 4.3% |
| Standard Deviation (Sample) | 1.9% | 4.4% |
| Standard Deviation (Population) | 1.9% | 4.4% |
Similar Demographics by Cognitive Disability
Demographics Similar to Immigrants by Cognitive Disability
In terms of cognitive disability, the demographic groups most similar to Immigrants are Immigrants from Portugal (17.2%, a difference of 0.020%), Immigrants from Syria (17.2%, a difference of 0.030%), Immigrants from Ecuador (17.2%, a difference of 0.060%), Immigrants from Albania (17.2%, a difference of 0.070%), and Ecuadorian (17.2%, a difference of 0.090%).
| Demographics | Rating | Rank | Cognitive Disability |
| Americans | 72.2 /100 | #161 | Good 17.2% |
| Yugoslavians | 71.6 /100 | #162 | Good 17.2% |
| Immigrants | Switzerland | 71.5 /100 | #163 | Good 17.2% |
| Armenians | 70.1 /100 | #164 | Good 17.2% |
| Immigrants | Albania | 64.9 /100 | #165 | Good 17.2% |
| Immigrants | Ecuador | 64.4 /100 | #166 | Good 17.2% |
| Immigrants | Syria | 63.5 /100 | #167 | Good 17.2% |
| Immigrants | Immigrants | 62.5 /100 | #168 | Good 17.2% |
| Immigrants | Portugal | 61.8 /100 | #169 | Good 17.2% |
| Ecuadorians | 59.6 /100 | #170 | Average 17.2% |
| Tlingit-Haida | 59.4 /100 | #171 | Average 17.2% |
| Immigrants | Turkey | 56.7 /100 | #172 | Average 17.2% |
| Immigrants | Northern Africa | 50.2 /100 | #173 | Average 17.3% |
| Laotians | 50.0 /100 | #174 | Average 17.3% |
| Tsimshian | 49.8 /100 | #175 | Average 17.3% |
Demographics Similar to Central American Indians by Cognitive Disability
In terms of cognitive disability, the demographic groups most similar to Central American Indians are Iroquois (18.2%, a difference of 0.010%), British West Indian (18.2%, a difference of 0.070%), Ottawa (18.2%, a difference of 0.080%), Immigrants from Africa (18.1%, a difference of 0.21%), and Native/Alaskan (18.1%, a difference of 0.24%).
| Demographics | Rating | Rank | Cognitive Disability |
| Kenyans | 0.1 /100 | #286 | Tragic 18.1% |
| Dutch West Indians | 0.1 /100 | #287 | Tragic 18.1% |
| Immigrants | West Indies | 0.1 /100 | #288 | Tragic 18.1% |
| Natives/Alaskans | 0.1 /100 | #289 | Tragic 18.1% |
| Immigrants | Africa | 0.1 /100 | #290 | Tragic 18.1% |
| Ottawa | 0.1 /100 | #291 | Tragic 18.2% |
| Iroquois | 0.1 /100 | #292 | Tragic 18.2% |
| Central American Indians | 0.1 /100 | #293 | Tragic 18.2% |
| British West Indians | 0.1 /100 | #294 | Tragic 18.2% |
| German Russians | 0.0 /100 | #295 | Tragic 18.2% |
| Immigrants | Burma/Myanmar | 0.0 /100 | #296 | Tragic 18.2% |
| Blackfeet | 0.0 /100 | #297 | Tragic 18.3% |
| Japanese | 0.0 /100 | #298 | Tragic 18.3% |
| Ghanaians | 0.0 /100 | #299 | Tragic 18.3% |
| Creek | 0.0 /100 | #300 | Tragic 18.3% |