Immigrants vs Immigrants from Israel Cognitive Disability
COMPARE
Immigrants
Immigrants from Israel
Cognitive Disability
Cognitive Disability Comparison
Immigrants
Immigrants from Israel
17.2%
COGNITIVE DISABILITY
62.5/ 100
METRIC RATING
168th/ 347
METRIC RANK
16.4%
COGNITIVE DISABILITY
99.9/ 100
METRIC RATING
32nd/ 347
METRIC RANK
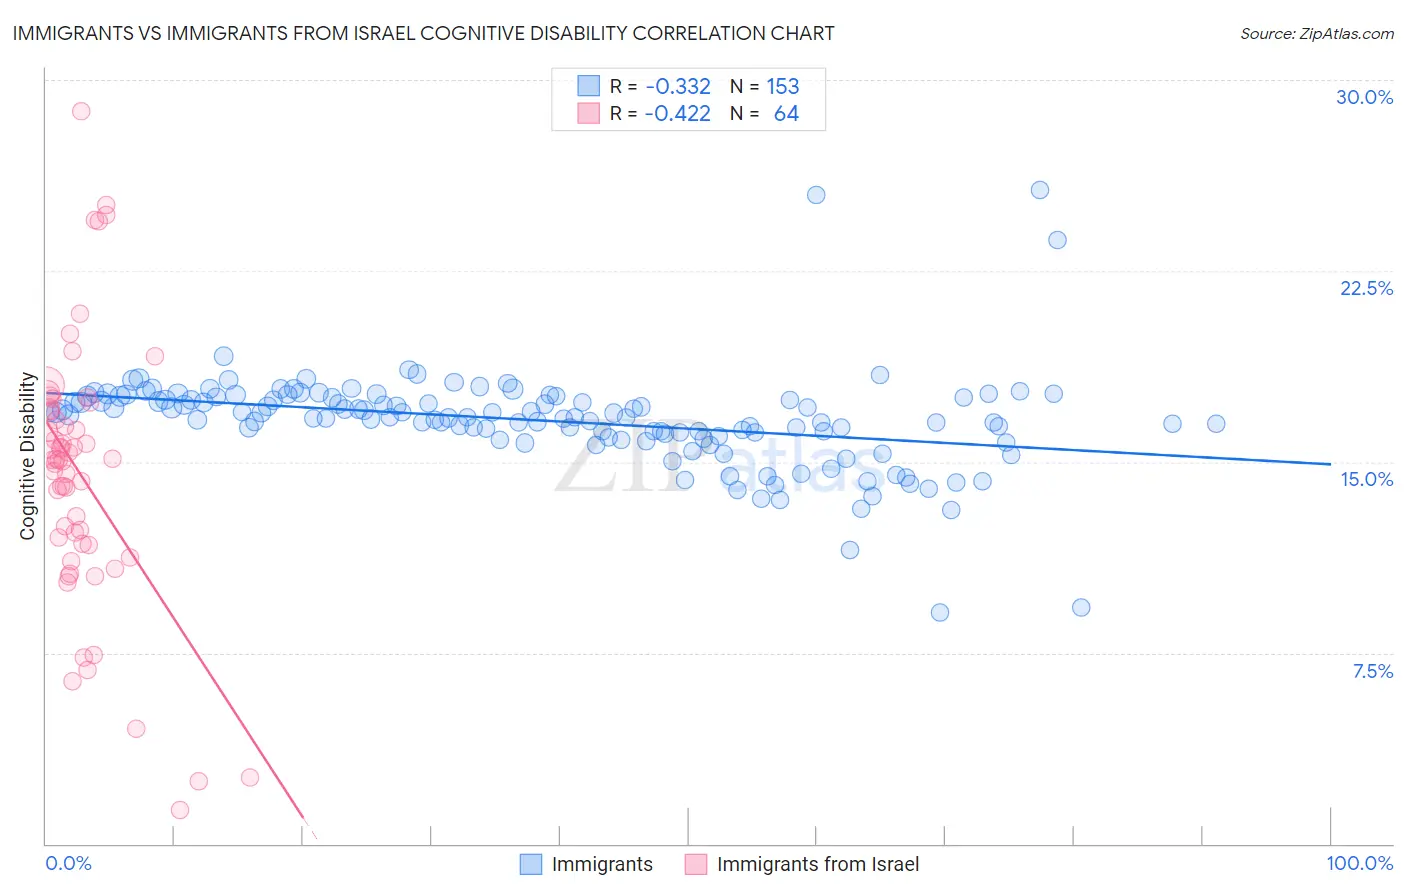
Immigrants vs Immigrants from Israel Cognitive Disability Correlation Chart
The statistical analysis conducted on geographies consisting of 577,580,100 people shows a mild negative correlation between the proportion of Immigrants and percentage of population with cognitive disability in the United States with a correlation coefficient (R) of -0.332 and weighted average of 17.2%. Similarly, the statistical analysis conducted on geographies consisting of 210,028,884 people shows a moderate negative correlation between the proportion of Immigrants from Israel and percentage of population with cognitive disability in the United States with a correlation coefficient (R) of -0.422 and weighted average of 16.4%, a difference of 5.0%.
Cognitive Disability Correlation Summary
| Measurement | Immigrants | Immigrants from Israel |
| Minimum | 9.1% | 1.3% |
| Maximum | 25.7% | 28.8% |
| Range | 16.6% | 27.5% |
| Mean | 16.6% | 14.5% |
| Median | 16.8% | 15.1% |
| Interquartile 25% (IQ1) | 16.0% | 11.8% |
| Interquartile 75% (IQ3) | 17.6% | 17.0% |
| Interquartile Range (IQR) | 1.5% | 5.3% |
| Standard Deviation (Sample) | 1.9% | 5.3% |
| Standard Deviation (Population) | 1.9% | 5.2% |
Similar Demographics by Cognitive Disability
Demographics Similar to Immigrants by Cognitive Disability
In terms of cognitive disability, the demographic groups most similar to Immigrants are Immigrants from Portugal (17.2%, a difference of 0.020%), Immigrants from Syria (17.2%, a difference of 0.030%), Immigrants from Ecuador (17.2%, a difference of 0.060%), Immigrants from Albania (17.2%, a difference of 0.070%), and Ecuadorian (17.2%, a difference of 0.090%).
| Demographics | Rating | Rank | Cognitive Disability |
| Americans | 72.2 /100 | #161 | Good 17.2% |
| Yugoslavians | 71.6 /100 | #162 | Good 17.2% |
| Immigrants | Switzerland | 71.5 /100 | #163 | Good 17.2% |
| Armenians | 70.1 /100 | #164 | Good 17.2% |
| Immigrants | Albania | 64.9 /100 | #165 | Good 17.2% |
| Immigrants | Ecuador | 64.4 /100 | #166 | Good 17.2% |
| Immigrants | Syria | 63.5 /100 | #167 | Good 17.2% |
| Immigrants | Immigrants | 62.5 /100 | #168 | Good 17.2% |
| Immigrants | Portugal | 61.8 /100 | #169 | Good 17.2% |
| Ecuadorians | 59.6 /100 | #170 | Average 17.2% |
| Tlingit-Haida | 59.4 /100 | #171 | Average 17.2% |
| Immigrants | Turkey | 56.7 /100 | #172 | Average 17.2% |
| Immigrants | Northern Africa | 50.2 /100 | #173 | Average 17.3% |
| Laotians | 50.0 /100 | #174 | Average 17.3% |
| Tsimshian | 49.8 /100 | #175 | Average 17.3% |
Demographics Similar to Immigrants from Israel by Cognitive Disability
In terms of cognitive disability, the demographic groups most similar to Immigrants from Israel are Immigrants from Romania (16.4%, a difference of 0.050%), Czech (16.4%, a difference of 0.070%), Italian (16.4%, a difference of 0.070%), Filipino (16.4%, a difference of 0.080%), and Russian (16.4%, a difference of 0.080%).
| Demographics | Rating | Rank | Cognitive Disability |
| Luxembourgers | 99.9 /100 | #25 | Exceptional 16.4% |
| Immigrants | Croatia | 99.9 /100 | #26 | Exceptional 16.4% |
| Immigrants | Pakistan | 99.9 /100 | #27 | Exceptional 16.4% |
| Poles | 99.9 /100 | #28 | Exceptional 16.4% |
| Filipinos | 99.9 /100 | #29 | Exceptional 16.4% |
| Czechs | 99.9 /100 | #30 | Exceptional 16.4% |
| Immigrants | Romania | 99.9 /100 | #31 | Exceptional 16.4% |
| Immigrants | Israel | 99.9 /100 | #32 | Exceptional 16.4% |
| Italians | 99.9 /100 | #33 | Exceptional 16.4% |
| Russians | 99.9 /100 | #34 | Exceptional 16.4% |
| Slovaks | 99.9 /100 | #35 | Exceptional 16.4% |
| Greeks | 99.9 /100 | #36 | Exceptional 16.4% |
| Slovenes | 99.9 /100 | #37 | Exceptional 16.5% |
| Immigrants | Eastern Europe | 99.9 /100 | #38 | Exceptional 16.5% |
| Bolivians | 99.9 /100 | #39 | Exceptional 16.5% |