Immigrants vs Scottish Married-couple Households
COMPARE
Immigrants
Scottish
Married-couple Households
Married-couple Households Comparison
Immigrants
Scottish
46.3%
MARRIED-COUPLE HOUSEHOLDS
43.8/ 100
METRIC RATING
177th/ 347
METRIC RANK
49.0%
MARRIED-COUPLE HOUSEHOLDS
99.7/ 100
METRIC RATING
35th/ 347
METRIC RANK
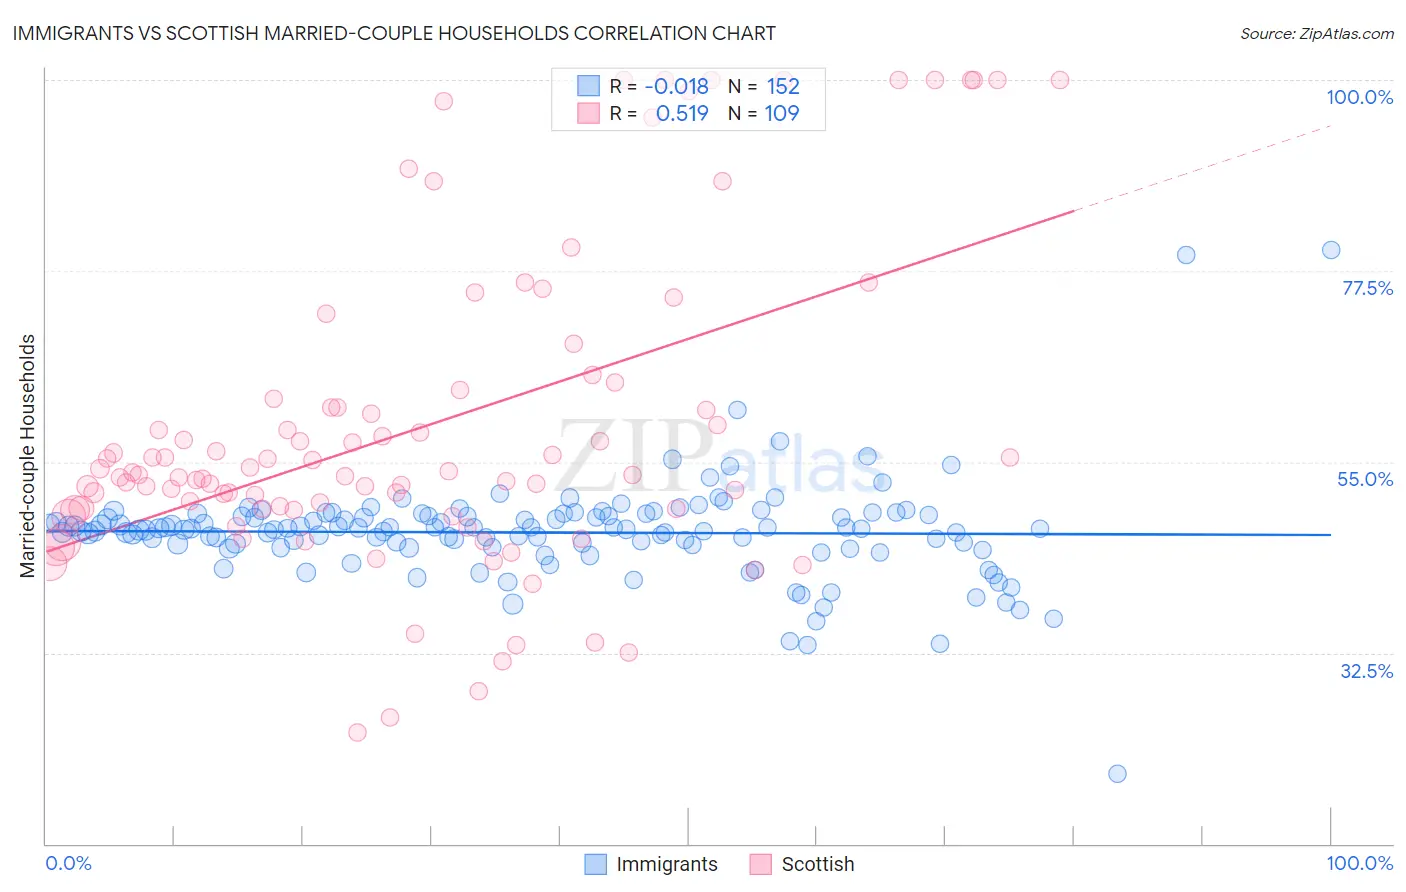
Immigrants vs Scottish Married-couple Households Correlation Chart
The statistical analysis conducted on geographies consisting of 577,047,094 people shows no correlation between the proportion of Immigrants and percentage of married-couple family households in the United States with a correlation coefficient (R) of -0.018 and weighted average of 46.3%. Similarly, the statistical analysis conducted on geographies consisting of 566,528,942 people shows a substantial positive correlation between the proportion of Scottish and percentage of married-couple family households in the United States with a correlation coefficient (R) of 0.519 and weighted average of 49.0%, a difference of 5.8%.
Married-couple Households Correlation Summary
| Measurement | Immigrants | Scottish |
| Minimum | 18.2% | 23.1% |
| Maximum | 80.0% | 100.0% |
| Range | 61.8% | 76.9% |
| Mean | 46.7% | 59.2% |
| Median | 47.1% | 53.4% |
| Interquartile 25% (IQ1) | 45.1% | 49.4% |
| Interquartile 75% (IQ3) | 48.7% | 62.9% |
| Interquartile Range (IQR) | 3.7% | 13.5% |
| Standard Deviation (Sample) | 6.1% | 18.8% |
| Standard Deviation (Population) | 6.1% | 18.7% |
Similar Demographics by Married-couple Households
Demographics Similar to Immigrants by Married-couple Households
In terms of married-couple households, the demographic groups most similar to Immigrants are Immigrants from Costa Rica (46.3%, a difference of 0.020%), Immigrants from Zimbabwe (46.3%, a difference of 0.030%), Cajun (46.4%, a difference of 0.060%), Mongolian (46.3%, a difference of 0.070%), and Malaysian (46.3%, a difference of 0.080%).
| Demographics | Rating | Rank | Married-couple Households |
| South Americans | 58.0 /100 | #170 | Average 46.6% |
| Immigrants | Chile | 55.7 /100 | #171 | Average 46.5% |
| Immigrants | Australia | 54.6 /100 | #172 | Average 46.5% |
| Immigrants | Norway | 52.0 /100 | #173 | Average 46.5% |
| Immigrants | Mexico | 50.0 /100 | #174 | Average 46.4% |
| Immigrants | Colombia | 46.1 /100 | #175 | Average 46.4% |
| Cajuns | 45.2 /100 | #176 | Average 46.4% |
| Immigrants | Immigrants | 43.8 /100 | #177 | Average 46.3% |
| Immigrants | Costa Rica | 43.4 /100 | #178 | Average 46.3% |
| Immigrants | Zimbabwe | 43.0 /100 | #179 | Average 46.3% |
| Mongolians | 42.0 /100 | #180 | Average 46.3% |
| Malaysians | 41.8 /100 | #181 | Average 46.3% |
| Yugoslavians | 38.9 /100 | #182 | Fair 46.2% |
| Immigrants | Brazil | 38.3 /100 | #183 | Fair 46.2% |
| Immigrants | Switzerland | 36.9 /100 | #184 | Fair 46.2% |
Demographics Similar to Scottish by Married-couple Households
In terms of married-couple households, the demographic groups most similar to Scottish are Italian (49.0%, a difference of 0.020%), Iranian (49.0%, a difference of 0.090%), Sri Lankan (49.0%, a difference of 0.090%), Immigrants from Asia (49.1%, a difference of 0.10%), and Hungarian (49.1%, a difference of 0.13%).
| Demographics | Rating | Rank | Married-couple Households |
| Germans | 99.8 /100 | #28 | Exceptional 49.2% |
| Maltese | 99.8 /100 | #29 | Exceptional 49.2% |
| Bolivians | 99.8 /100 | #30 | Exceptional 49.2% |
| Native Hawaiians | 99.8 /100 | #31 | Exceptional 49.1% |
| Hungarians | 99.8 /100 | #32 | Exceptional 49.1% |
| Immigrants | Asia | 99.7 /100 | #33 | Exceptional 49.1% |
| Italians | 99.7 /100 | #34 | Exceptional 49.0% |
| Scottish | 99.7 /100 | #35 | Exceptional 49.0% |
| Iranians | 99.7 /100 | #36 | Exceptional 49.0% |
| Sri Lankans | 99.7 /100 | #37 | Exceptional 49.0% |
| Greeks | 99.7 /100 | #38 | Exceptional 48.9% |
| Lithuanians | 99.6 /100 | #39 | Exceptional 48.9% |
| Immigrants | Bolivia | 99.6 /100 | #40 | Exceptional 48.9% |
| Immigrants | Lebanon | 99.6 /100 | #41 | Exceptional 48.9% |
| Immigrants | Vietnam | 99.6 /100 | #42 | Exceptional 48.8% |