Russian vs Scottish Cognitive Disability
COMPARE
Russian
Scottish
Cognitive Disability
Cognitive Disability Comparison
Russians
Scottish
16.4%
COGNITIVE DISABILITY
99.9/ 100
METRIC RATING
34th/ 347
METRIC RANK
16.9%
COGNITIVE DISABILITY
95.0/ 100
METRIC RATING
120th/ 347
METRIC RANK
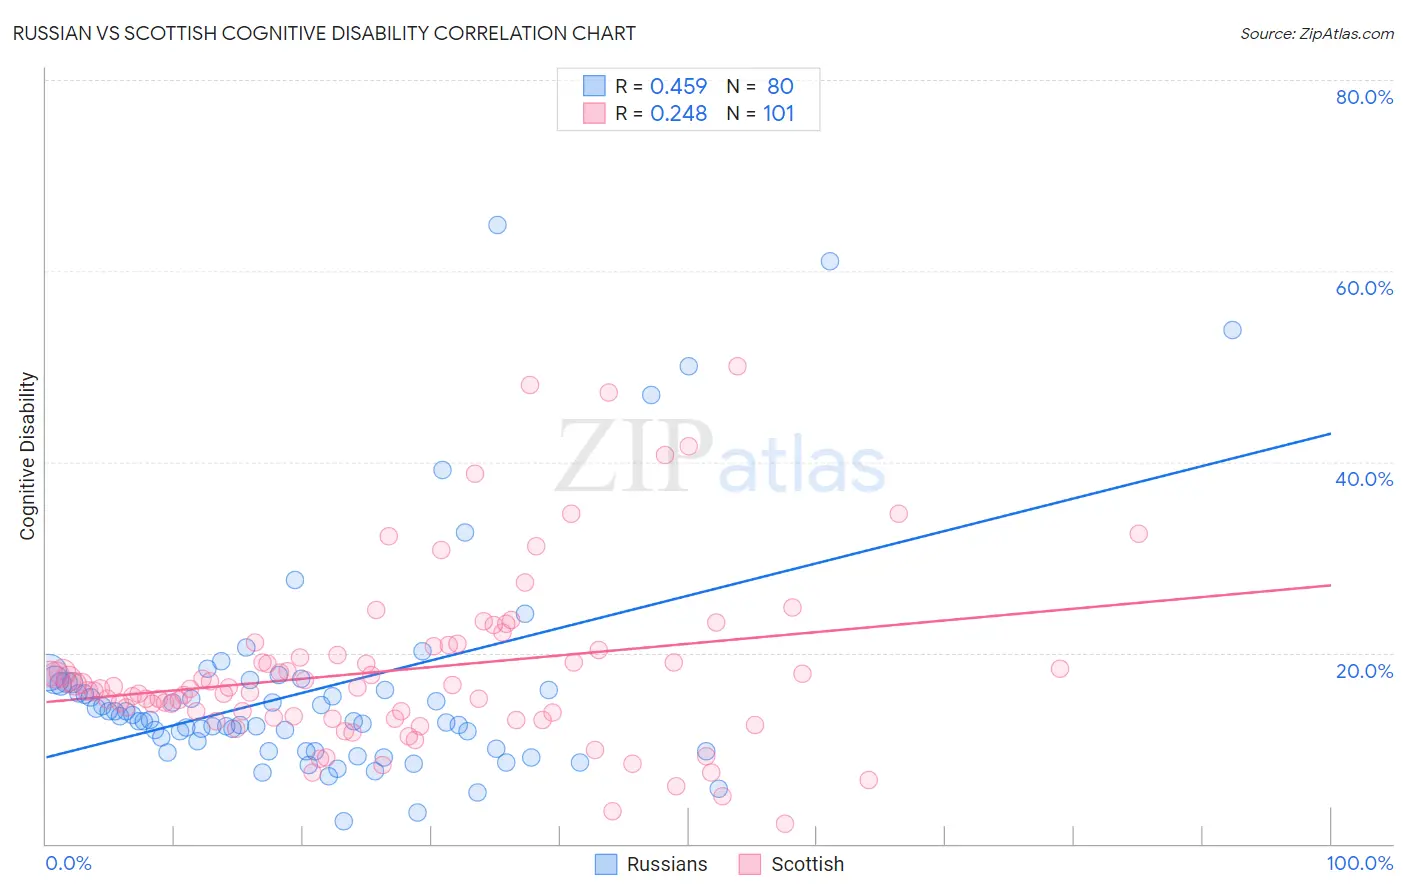
Russian vs Scottish Cognitive Disability Correlation Chart
The statistical analysis conducted on geographies consisting of 512,152,080 people shows a moderate positive correlation between the proportion of Russians and percentage of population with cognitive disability in the United States with a correlation coefficient (R) of 0.459 and weighted average of 16.4%. Similarly, the statistical analysis conducted on geographies consisting of 566,987,666 people shows a weak positive correlation between the proportion of Scottish and percentage of population with cognitive disability in the United States with a correlation coefficient (R) of 0.248 and weighted average of 16.9%, a difference of 3.1%.
Cognitive Disability Correlation Summary
| Measurement | Russian | Scottish |
| Minimum | 2.3% | 2.1% |
| Maximum | 64.9% | 50.0% |
| Range | 62.5% | 47.9% |
| Mean | 16.1% | 18.2% |
| Median | 12.9% | 16.3% |
| Interquartile 25% (IQ1) | 9.9% | 13.2% |
| Interquartile 75% (IQ3) | 16.8% | 20.5% |
| Interquartile Range (IQR) | 7.0% | 7.3% |
| Standard Deviation (Sample) | 11.7% | 9.1% |
| Standard Deviation (Population) | 11.6% | 9.0% |
Similar Demographics by Cognitive Disability
Demographics Similar to Russians by Cognitive Disability
In terms of cognitive disability, the demographic groups most similar to Russians are Italian (16.4%, a difference of 0.0%), Immigrants from Israel (16.4%, a difference of 0.080%), Slovak (16.4%, a difference of 0.080%), Greek (16.4%, a difference of 0.090%), and Immigrants from Romania (16.4%, a difference of 0.13%).
| Demographics | Rating | Rank | Cognitive Disability |
| Immigrants | Pakistan | 99.9 /100 | #27 | Exceptional 16.4% |
| Poles | 99.9 /100 | #28 | Exceptional 16.4% |
| Filipinos | 99.9 /100 | #29 | Exceptional 16.4% |
| Czechs | 99.9 /100 | #30 | Exceptional 16.4% |
| Immigrants | Romania | 99.9 /100 | #31 | Exceptional 16.4% |
| Immigrants | Israel | 99.9 /100 | #32 | Exceptional 16.4% |
| Italians | 99.9 /100 | #33 | Exceptional 16.4% |
| Russians | 99.9 /100 | #34 | Exceptional 16.4% |
| Slovaks | 99.9 /100 | #35 | Exceptional 16.4% |
| Greeks | 99.9 /100 | #36 | Exceptional 16.4% |
| Slovenes | 99.9 /100 | #37 | Exceptional 16.5% |
| Immigrants | Eastern Europe | 99.9 /100 | #38 | Exceptional 16.5% |
| Bolivians | 99.9 /100 | #39 | Exceptional 16.5% |
| Immigrants | Belarus | 99.9 /100 | #40 | Exceptional 16.5% |
| Cubans | 99.9 /100 | #41 | Exceptional 16.5% |
Demographics Similar to Scottish by Cognitive Disability
In terms of cognitive disability, the demographic groups most similar to Scottish are Immigrants from China (16.9%, a difference of 0.020%), Immigrants from Western Europe (16.9%, a difference of 0.030%), Portuguese (16.9%, a difference of 0.040%), Turkish (16.9%, a difference of 0.070%), and South African (16.9%, a difference of 0.080%).
| Demographics | Rating | Rank | Cognitive Disability |
| Immigrants | Sri Lanka | 97.1 /100 | #113 | Exceptional 16.8% |
| Koreans | 97.1 /100 | #114 | Exceptional 16.8% |
| Yup'ik | 96.9 /100 | #115 | Exceptional 16.9% |
| Inupiat | 96.5 /100 | #116 | Exceptional 16.9% |
| Immigrants | Japan | 96.2 /100 | #117 | Exceptional 16.9% |
| Immigrants | Denmark | 96.2 /100 | #118 | Exceptional 16.9% |
| South Africans | 95.5 /100 | #119 | Exceptional 16.9% |
| Scottish | 95.0 /100 | #120 | Exceptional 16.9% |
| Immigrants | China | 94.9 /100 | #121 | Exceptional 16.9% |
| Immigrants | Western Europe | 94.8 /100 | #122 | Exceptional 16.9% |
| Portuguese | 94.7 /100 | #123 | Exceptional 16.9% |
| Turks | 94.5 /100 | #124 | Exceptional 16.9% |
| Scandinavians | 94.1 /100 | #125 | Exceptional 16.9% |
| Europeans | 93.4 /100 | #126 | Exceptional 17.0% |
| Immigrants | Costa Rica | 93.1 /100 | #127 | Exceptional 17.0% |