Immigrants vs Immigrants from Hungary Per Capita Income
COMPARE
Immigrants
Immigrants from Hungary
Per Capita Income
Per Capita Income Comparison
Immigrants
Immigrants from Hungary
$43,010
PER CAPITA INCOME
32.5/ 100
METRIC RATING
185th/ 347
METRIC RANK
$49,303
PER CAPITA INCOME
99.8/ 100
METRIC RATING
72nd/ 347
METRIC RANK
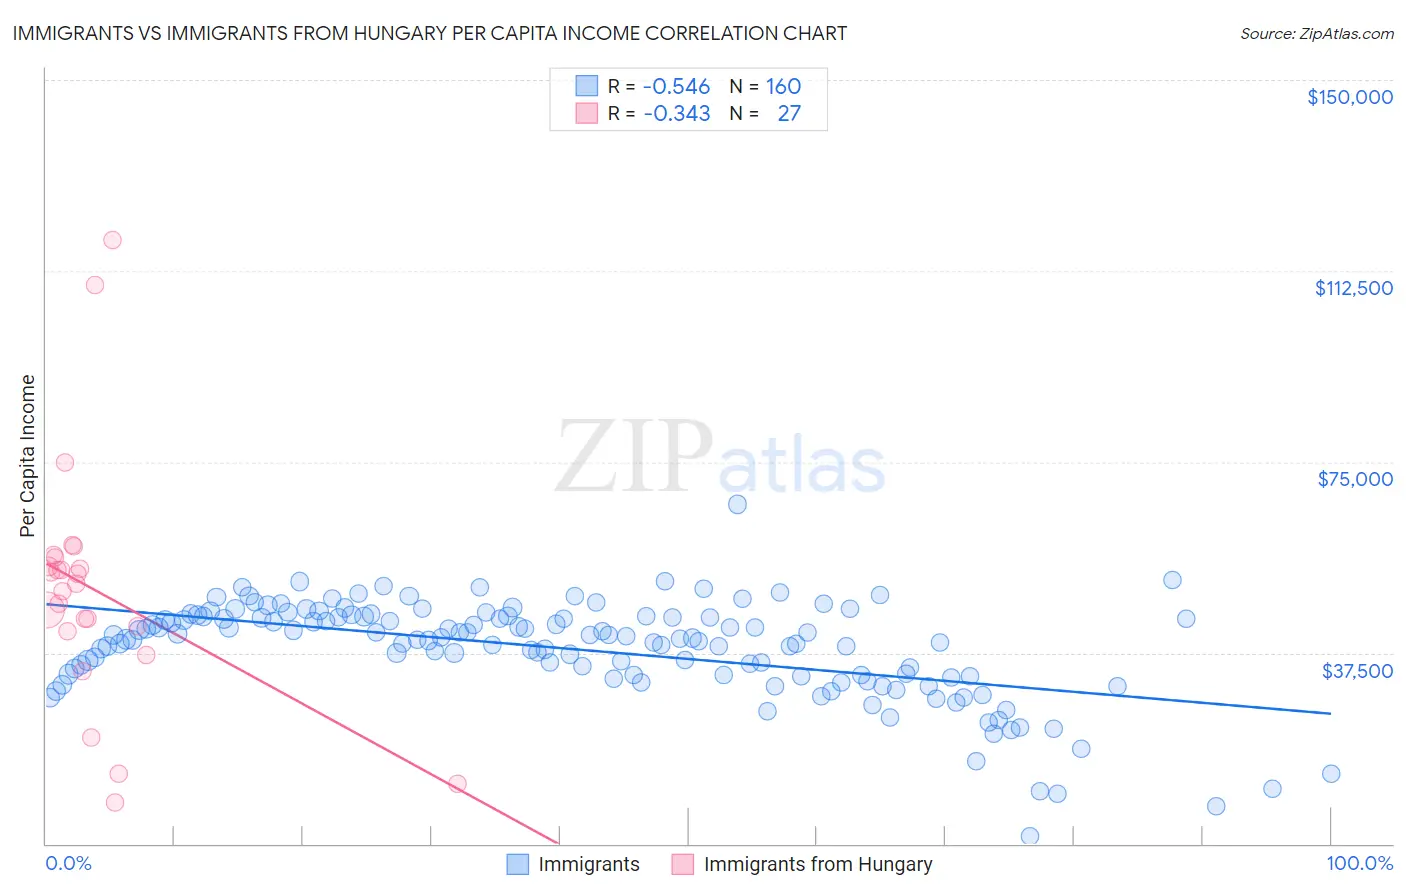
Immigrants vs Immigrants from Hungary Per Capita Income Correlation Chart
The statistical analysis conducted on geographies consisting of 577,833,144 people shows a substantial negative correlation between the proportion of Immigrants and per capita income in the United States with a correlation coefficient (R) of -0.546 and weighted average of $43,010. Similarly, the statistical analysis conducted on geographies consisting of 195,712,632 people shows a mild negative correlation between the proportion of Immigrants from Hungary and per capita income in the United States with a correlation coefficient (R) of -0.343 and weighted average of $49,303, a difference of 14.6%.
Per Capita Income Correlation Summary
| Measurement | Immigrants | Immigrants from Hungary |
| Minimum | $1,397 | $8,083 |
| Maximum | $66,654 | $118,659 |
| Range | $65,257 | $110,576 |
| Mean | $38,278 | $49,900 |
| Median | $40,300 | $51,036 |
| Interquartile 25% (IQ1) | $33,050 | $41,686 |
| Interquartile 75% (IQ3) | $44,506 | $56,245 |
| Interquartile Range (IQR) | $11,456 | $14,559 |
| Standard Deviation (Sample) | $9,625 | $24,211 |
| Standard Deviation (Population) | $9,595 | $23,759 |
Similar Demographics by Per Capita Income
Demographics Similar to Immigrants by Per Capita Income
In terms of per capita income, the demographic groups most similar to Immigrants are French Canadian ($43,003, a difference of 0.020%), Spaniard ($43,028, a difference of 0.040%), Immigrants from Colombia ($42,971, a difference of 0.090%), German ($43,067, a difference of 0.13%), and Immigrants from Africa ($42,950, a difference of 0.14%).
| Demographics | Rating | Rank | Per Capita Income |
| Immigrants | Costa Rica | 44.5 /100 | #178 | Average $43,464 |
| Finns | 44.4 /100 | #179 | Average $43,461 |
| Sierra Leoneans | 42.9 /100 | #180 | Average $43,405 |
| Welsh | 38.2 /100 | #181 | Fair $43,233 |
| Immigrants | Vietnam | 38.1 /100 | #182 | Fair $43,229 |
| Germans | 33.9 /100 | #183 | Fair $43,067 |
| Spaniards | 32.9 /100 | #184 | Fair $43,028 |
| Immigrants | Immigrants | 32.5 /100 | #185 | Fair $43,010 |
| French Canadians | 32.3 /100 | #186 | Fair $43,003 |
| Immigrants | Colombia | 31.5 /100 | #187 | Fair $42,971 |
| Immigrants | Africa | 31.0 /100 | #188 | Fair $42,950 |
| Bermudans | 30.1 /100 | #189 | Fair $42,911 |
| Kenyans | 27.7 /100 | #190 | Fair $42,808 |
| Yugoslavians | 27.4 /100 | #191 | Fair $42,792 |
| Iraqis | 26.7 /100 | #192 | Fair $42,760 |
Demographics Similar to Immigrants from Hungary by Per Capita Income
In terms of per capita income, the demographic groups most similar to Immigrants from Hungary are Immigrants from North America ($49,302, a difference of 0.0%), Greek ($49,309, a difference of 0.010%), Immigrants from Eastern Europe ($49,316, a difference of 0.030%), Immigrants from Canada ($49,412, a difference of 0.22%), and Mongolian ($49,173, a difference of 0.26%).
| Demographics | Rating | Rank | Per Capita Income |
| Bolivians | 99.9 /100 | #65 | Exceptional $49,526 |
| Immigrants | Bulgaria | 99.9 /100 | #66 | Exceptional $49,482 |
| Immigrants | Romania | 99.9 /100 | #67 | Exceptional $49,463 |
| Lithuanians | 99.8 /100 | #68 | Exceptional $49,448 |
| Immigrants | Canada | 99.8 /100 | #69 | Exceptional $49,412 |
| Immigrants | Eastern Europe | 99.8 /100 | #70 | Exceptional $49,316 |
| Greeks | 99.8 /100 | #71 | Exceptional $49,309 |
| Immigrants | Hungary | 99.8 /100 | #72 | Exceptional $49,303 |
| Immigrants | North America | 99.8 /100 | #73 | Exceptional $49,302 |
| Mongolians | 99.8 /100 | #74 | Exceptional $49,173 |
| Immigrants | Bolivia | 99.7 /100 | #75 | Exceptional $48,970 |
| Immigrants | England | 99.7 /100 | #76 | Exceptional $48,844 |
| Immigrants | Kazakhstan | 99.7 /100 | #77 | Exceptional $48,747 |
| Immigrants | Italy | 99.6 /100 | #78 | Exceptional $48,654 |
| Romanians | 99.5 /100 | #79 | Exceptional $48,445 |