Immigrants from Ghana vs Immigrants from Eastern Europe Vision Disability

COMPARE

Immigrants from Ghana
Race
Ancestry
AfghanAfricanAlaska NativeAlaskan AthabascanAlbanianAleutAlsatianAmericanApacheArabArapahoArgentineanArmenianAssyrian/Chaldean/SyriacAustralianAustrianBahamianBangladeshiBarbadianBasqueBelgianBelizeanBermudanBhutaneseBlackfeetBolivianBrazilianBritishBritish West IndianBulgarianBurmeseCajunCambodianCanadianCape VerdeanCarpatho RusynCelticCentral AmericanCentral American IndianCherokeeCheyenneChickasawChileanChineseChippewaChoctawColombianColvilleComancheCosta RicanCreeCreekCroatianCrowCubanCypriotCzechCzechoslovakianDanishDelawareDominicanDutchDutch West IndianEastern EuropeanEcuadorianEgyptianEnglishEstonianEthiopianEuropeanFijianFilipinoFinnishFrenchFrench American IndianFrench CanadianGermanGerman RussianGhanaianGreekGuamanian/ChamorroGuatemalanGuyaneseHaitianHmongHonduranHopiHoumaHungarianIcelanderIndian (Asian)IndonesianInupiatIranianIraqiIrishIroquoisIsraeliItalianJamaicanJapaneseJordanianKenyanKiowaKoreanLaotianLatvianLebaneseLiberianLithuanianLumbeeLuxembourgerMacedonianMalaysianMalteseMarshalleseMenomineeMexicanMexican American IndianMongolianMoroccanNative HawaiianNavajoNepaleseNew ZealanderNicaraguanNigerianNorthern EuropeanNorwegianOkinawanOsageOttawaPaiutePakistaniPalestinianPanamanianParaguayanPennsylvania GermanPeruvianPimaPolishPortuguesePotawatomiPuebloPuerto RicanPuget Sound SalishRomanianRussianSalvadoranSamoanScandinavianScotch-IrishScottishSeminoleSenegaleseSerbianShoshoneSierra LeoneanSiouxSlavicSlovakSloveneSomaliSouth AfricanSouth AmericanSouth American IndianSoviet UnionSpaniardSpanishSpanish AmericanSpanish American IndianSri LankanSubsaharan AfricanSudaneseSwedishSwissSyrianTaiwaneseThaiTlingit-HaidaTohono O'OdhamTonganTrinidadian and TobagonianTsimshianTurkishU.S. Virgin IslanderUgandanUkrainianUruguayanUteVenezuelanVietnameseWelshWest IndianYakamaYaquiYugoslavianYumanYup'ikZimbabwean
Immigration
NonimmigrantsImmigrantsAfghanistanAfricaAlbaniaArgentinaArmeniaAsiaAustraliaAustriaBahamasBangladeshBarbadosBelarusBelgiumBelizeBoliviaBosnia and HerzegovinaBrazilBulgariaBurma/MyanmarCabo VerdeCambodiaCameroonCanadaCaribbeanCentral AmericaChileChinaColombiaCongoCosta RicaCroatiaCubaCzechoslovakiaDenmarkDominicaDominican RepublicEastern AfricaEastern AsiaEcuadorEgyptEl SalvadorEnglandEritreaEthiopiaEuropeFijiFranceGermanyGhanaGreeceGrenadaGuatemalaGuyanaHaitiHondurasHong KongHungaryIndiaIndonesiaIranIraqIrelandIsraelItalyJamaicaJapanJordanKazakhstanKenyaKoreaKuwaitLaosLatin AmericaLatviaLebanonLiberiaLithuaniaMalaysiaMexicoMicronesiaMiddle AfricaMoldovaMoroccoNepalNetherlandsNicaraguaNigeriaNorth AmericaNorth MacedoniaNorthern AfricaNorthern EuropeNorwayOceaniaPakistanPanamaPeruPhilippinesPolandPortugalRomaniaRussiaSaudi ArabiaScotlandSenegalSerbiaSierra LeoneSingaporeSomaliaSouth AfricaSouth AmericaSouth Central AsiaSouth Eastern AsiaSouthern EuropeSpainSri LankaSt. Vincent and the GrenadinesSudanSwedenSwitzerlandSyriaTaiwanThailandTrinidad and TobagoTurkeyUgandaUkraineUruguayUzbekistanVenezuelaVietnamWest IndiesWestern AfricaWestern AsiaWestern EuropeYemenZaireZimbabweAzores
Immigrants from Eastern Europe
Race
Ancestry
AfghanAfricanAlaska NativeAlaskan AthabascanAlbanianAleutAlsatianAmericanApacheArabArapahoArgentineanArmenianAssyrian/Chaldean/SyriacAustralianAustrianBahamianBangladeshiBarbadianBasqueBelgianBelizeanBermudanBhutaneseBlackfeetBolivianBrazilianBritishBritish West IndianBulgarianBurmeseCajunCambodianCanadianCape VerdeanCarpatho RusynCelticCentral AmericanCentral American IndianCherokeeCheyenneChickasawChileanChineseChippewaChoctawColombianColvilleComancheCosta RicanCreeCreekCroatianCrowCubanCypriotCzechCzechoslovakianDanishDelawareDominicanDutchDutch West IndianEastern EuropeanEcuadorianEgyptianEnglishEstonianEthiopianEuropeanFijianFilipinoFinnishFrenchFrench American IndianFrench CanadianGermanGerman RussianGhanaianGreekGuamanian/ChamorroGuatemalanGuyaneseHaitianHmongHonduranHopiHoumaHungarianIcelanderIndian (Asian)IndonesianInupiatIranianIraqiIrishIroquoisIsraeliItalianJamaicanJapaneseJordanianKenyanKiowaKoreanLaotianLatvianLebaneseLiberianLithuanianLumbeeLuxembourgerMacedonianMalaysianMalteseMarshalleseMenomineeMexicanMexican American IndianMongolianMoroccanNative HawaiianNavajoNepaleseNew ZealanderNicaraguanNigerianNorthern EuropeanNorwegianOkinawanOsageOttawaPaiutePakistaniPalestinianPanamanianParaguayanPennsylvania GermanPeruvianPimaPolishPortuguesePotawatomiPuebloPuerto RicanPuget Sound SalishRomanianRussianSalvadoranSamoanScandinavianScotch-IrishScottishSeminoleSenegaleseSerbianShoshoneSierra LeoneanSiouxSlavicSlovakSloveneSomaliSouth AfricanSouth AmericanSouth American IndianSoviet UnionSpaniardSpanishSpanish AmericanSpanish American IndianSri LankanSubsaharan AfricanSudaneseSwedishSwissSyrianTaiwaneseThaiTlingit-HaidaTohono O'OdhamTonganTrinidadian and TobagonianTsimshianTurkishU.S. Virgin IslanderUgandanUkrainianUruguayanUteVenezuelanVietnameseWelshWest IndianYakamaYaquiYugoslavianYumanYup'ikZimbabwean
Immigration
NonimmigrantsImmigrantsAfghanistanAfricaAlbaniaArgentinaArmeniaAsiaAustraliaAustriaBahamasBangladeshBarbadosBelarusBelgiumBelizeBoliviaBosnia and HerzegovinaBrazilBulgariaBurma/MyanmarCabo VerdeCambodiaCameroonCanadaCaribbeanCentral AmericaChileChinaColombiaCongoCosta RicaCroatiaCubaCzechoslovakiaDenmarkDominicaDominican RepublicEastern AfricaEastern AsiaEastern EuropeEcuadorEgyptEl SalvadorEnglandEritreaEthiopiaEuropeFijiFranceGermanyGreeceGrenadaGuatemalaGuyanaHaitiHondurasHong KongHungaryIndiaIndonesiaIranIraqIrelandIsraelItalyJamaicaJapanJordanKazakhstanKenyaKoreaKuwaitLaosLatin AmericaLatviaLebanonLiberiaLithuaniaMalaysiaMexicoMicronesiaMiddle AfricaMoldovaMoroccoNepalNetherlandsNicaraguaNigeriaNorth AmericaNorth MacedoniaNorthern AfricaNorthern EuropeNorwayOceaniaPakistanPanamaPeruPhilippinesPolandPortugalRomaniaRussiaSaudi ArabiaScotlandSenegalSerbiaSierra LeoneSingaporeSomaliaSouth AfricaSouth AmericaSouth Central AsiaSouth Eastern AsiaSouthern EuropeSpainSri LankaSt. Vincent and the GrenadinesSudanSwedenSwitzerlandSyriaTaiwanThailandTrinidad and TobagoTurkeyUgandaUkraineUruguayUzbekistanVenezuelaVietnamWest IndiesWestern AfricaWestern AsiaWestern EuropeYemenZaireZimbabweAzores
Vision Disability
Income
Poverty
Unemployment
Labor Participation
Family Structure
Vehicle Availability
Education Level
Disability

Vision Disability Comparison

Immigrants from Ghana

Immigrants from Eastern Europe

Tragic
Exceptional
2.2%
VISION DISABILITY
8.9/ 100
METRIC RATING
213th/ 347
METRIC RANK
2.0%
VISION DISABILITY
98.3/ 100
METRIC RATING
78th/ 347
METRIC RANK

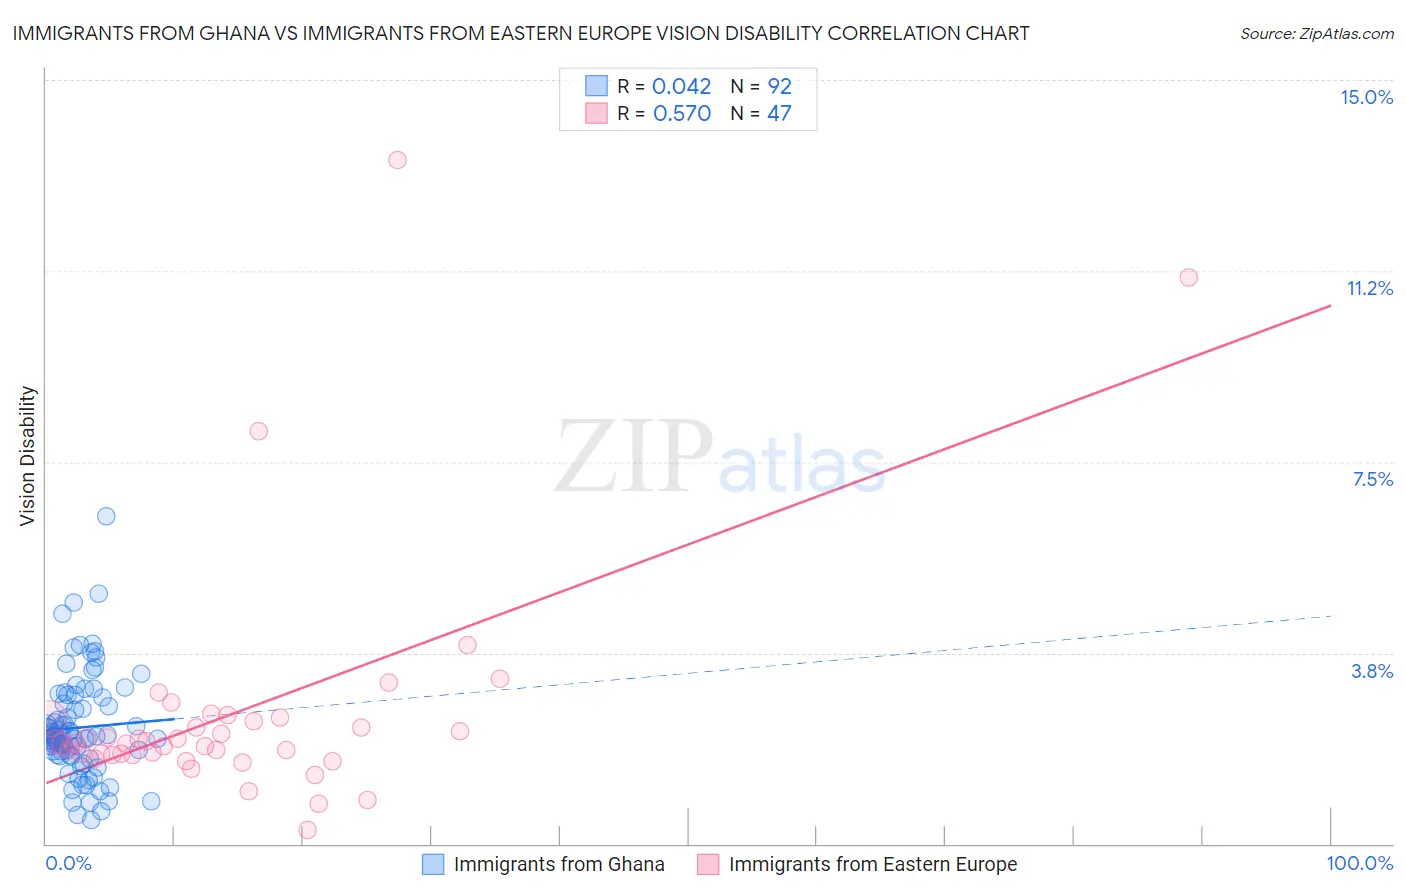
Immigrants from Ghana vs Immigrants from Eastern Europe Vision Disability Correlation Chart

The statistical analysis conducted on geographies consisting of 199,859,756 people shows no correlation between the proportion of Immigrants from Ghana and percentage of population with vision disability in the United States with a correlation coefficient (R) of 0.042 and weighted average of 2.2%. Similarly, the statistical analysis conducted on geographies consisting of 475,183,449 people shows a substantial positive correlation between the proportion of Immigrants from Eastern Europe and percentage of population with vision disability in the United States with a correlation coefficient (R) of 0.570 and weighted average of 2.0%, a difference of 10.7%.
Immigrants from Ghana vs Immigrants from Eastern Europe Vision Disability

Vision Disability Correlation Summary

MeasurementImmigrants from GhanaImmigrants from Eastern Europe
Minimum0.47%0.27%
Maximum6.4%13.4%
Range6.0%13.2%
Mean2.3%2.6%
Median2.1%2.0%
Interquartile 25% (IQ1)1.7%1.8%
Interquartile 75% (IQ3)2.8%2.4%
Interquartile Range (IQR)1.1%0.70%
Standard Deviation (Sample)1.0%2.3%
Standard Deviation (Population)1.0%2.3%

Similar Demographics by Vision Disability

Demographics Similar to Immigrants from Ghana by Vision Disability

In terms of vision disability, the demographic groups most similar to Immigrants from Ghana are Bermudan (2.2%, a difference of 0.010%), Indonesian (2.2%, a difference of 0.10%), Trinidadian and Tobagonian (2.2%, a difference of 0.13%), Nigerian (2.3%, a difference of 0.34%), and Immigrants from Uruguay (2.2%, a difference of 0.44%).
DemographicsRating | RankVision Disability
Pennsylvania Germans
14.5
/100
|
#206
Poor
2.2%
Immigrants | Nigeria
13.5
/100
|
#207
Poor
2.2%
Germans
13.4
/100
|
#208
Poor
2.2%
Immigrants | Brazil
13.1
/100
|
#209
Poor
2.2%
Immigrants | Uruguay
11.5
/100
|
#210
Poor
2.2%
Indonesians
9.5
/100
|
#211
Tragic
2.2%
Bermudans
9.0
/100
|
#212
Tragic
2.2%
Immigrants | Ghana
8.9
/100
|
#213
Tragic
2.2%
Trinidadians and Tobagonians
8.2
/100
|
#214
Tragic
2.2%
Nigerians
7.2
/100
|
#215
Tragic
2.3%
Immigrants | Trinidad and Tobago
6.1
/100
|
#216
Tragic
2.3%
Barbadians
5.1
/100
|
#217
Tragic
2.3%
Portuguese
4.9
/100
|
#218
Tragic
2.3%
Ecuadorians
4.6
/100
|
#219
Tragic
2.3%
Guamanians/Chamorros
3.9
/100
|
#220
Tragic
2.3%

Demographics Similar to Immigrants from Eastern Europe by Vision Disability

In terms of vision disability, the demographic groups most similar to Immigrants from Eastern Europe are Paraguayan (2.0%, a difference of 0.030%), Immigrants from Jordan (2.0%, a difference of 0.030%), Palestinian (2.0%, a difference of 0.050%), Immigrants from North Macedonia (2.0%, a difference of 0.050%), and Immigrants from Eritrea (2.0%, a difference of 0.11%).
DemographicsRating | RankVision Disability
Immigrants | Northern Europe
98.6
/100
|
#71
Exceptional
2.0%
Immigrants | France
98.5
/100
|
#72
Exceptional
2.0%
Immigrants | Eritrea
98.4
/100
|
#73
Exceptional
2.0%
Palestinians
98.3
/100
|
#74
Exceptional
2.0%
Immigrants | North Macedonia
98.3
/100
|
#75
Exceptional
2.0%
Paraguayans
98.3
/100
|
#76
Exceptional
2.0%
Immigrants | Jordan
98.3
/100
|
#77
Exceptional
2.0%
Immigrants | Eastern Europe
98.3
/100
|
#78
Exceptional
2.0%
Assyrians/Chaldeans/Syriacs
98.1
/100
|
#79
Exceptional
2.0%
Lithuanians
97.7
/100
|
#80
Exceptional
2.0%
Soviet Union
97.6
/100
|
#81
Exceptional
2.0%
Immigrants | Poland
97.6
/100
|
#82
Exceptional
2.0%
Immigrants | Western Asia
97.5
/100
|
#83
Exceptional
2.0%
Immigrants | Latvia
97.3
/100
|
#84
Exceptional
2.0%
Chinese
97.2
/100
|
#85
Exceptional
2.0%