Ugandan vs Immigrants from Eastern Europe Vision Disability
COMPARE
Ugandan
Immigrants from Eastern Europe
Vision Disability
Vision Disability Comparison
Ugandans
Immigrants from Eastern Europe
2.1%
VISION DISABILITY
92.2/ 100
METRIC RATING
116th/ 347
METRIC RANK
2.0%
VISION DISABILITY
98.3/ 100
METRIC RATING
78th/ 347
METRIC RANK
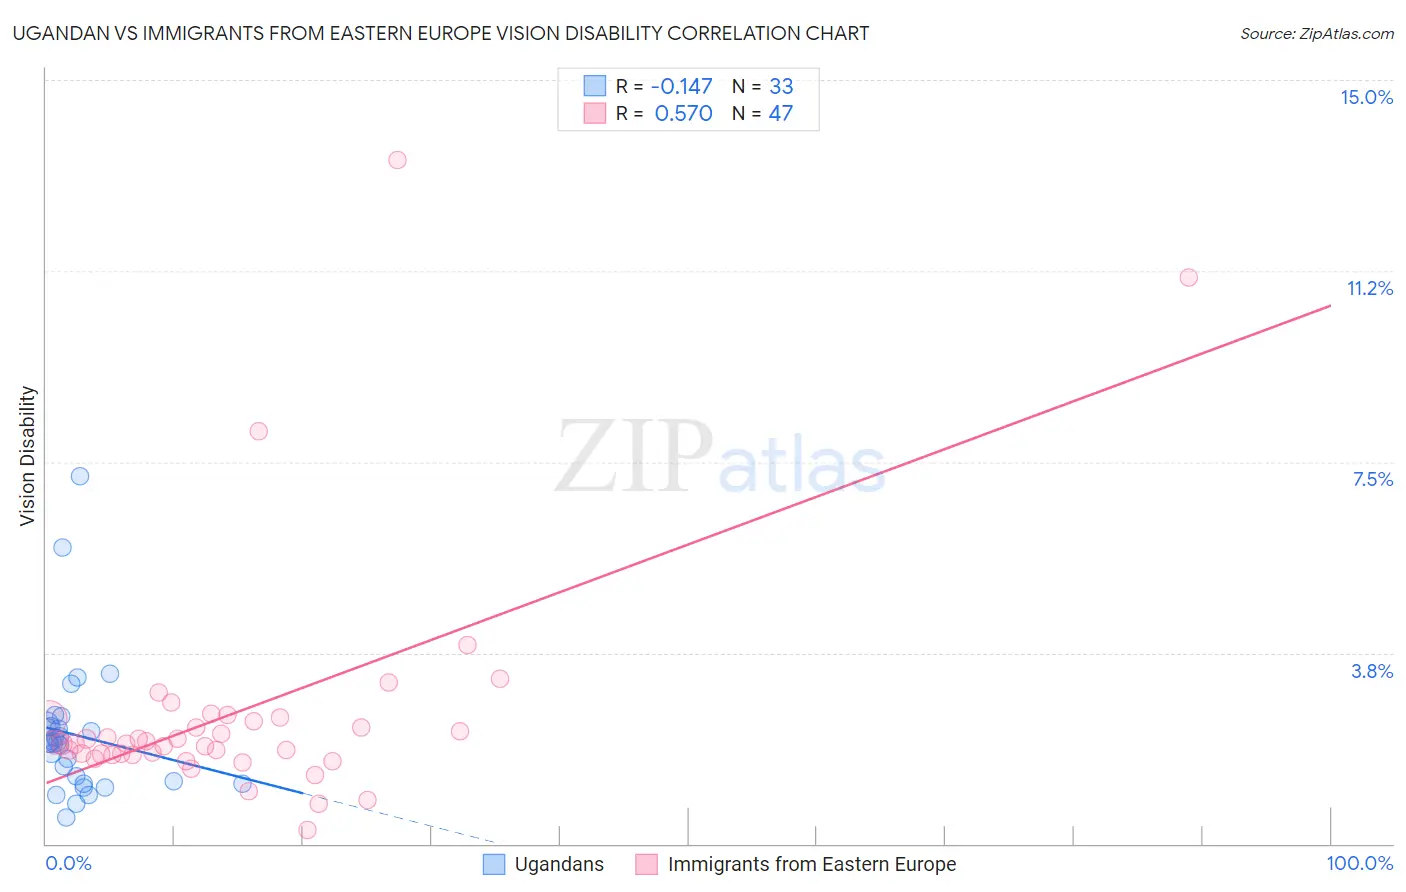
Ugandan vs Immigrants from Eastern Europe Vision Disability Correlation Chart
The statistical analysis conducted on geographies consisting of 94,002,961 people shows a poor negative correlation between the proportion of Ugandans and percentage of population with vision disability in the United States with a correlation coefficient (R) of -0.147 and weighted average of 2.1%. Similarly, the statistical analysis conducted on geographies consisting of 475,183,449 people shows a substantial positive correlation between the proportion of Immigrants from Eastern Europe and percentage of population with vision disability in the United States with a correlation coefficient (R) of 0.570 and weighted average of 2.0%, a difference of 2.6%.
Vision Disability Correlation Summary
| Measurement | Ugandan | Immigrants from Eastern Europe |
| Minimum | 0.51% | 0.27% |
| Maximum | 7.2% | 13.4% |
| Range | 6.7% | 13.2% |
| Mean | 2.1% | 2.6% |
| Median | 2.0% | 2.0% |
| Interquartile 25% (IQ1) | 1.2% | 1.8% |
| Interquartile 75% (IQ3) | 2.3% | 2.4% |
| Interquartile Range (IQR) | 1.1% | 0.70% |
| Standard Deviation (Sample) | 1.3% | 2.3% |
| Standard Deviation (Population) | 1.3% | 2.3% |
Similar Demographics by Vision Disability
Demographics Similar to Ugandans by Vision Disability
In terms of vision disability, the demographic groups most similar to Ugandans are Immigrants from Vietnam (2.1%, a difference of 0.0%), Croatian (2.1%, a difference of 0.030%), Polish (2.1%, a difference of 0.040%), Kenyan (2.1%, a difference of 0.060%), and Immigrants from Denmark (2.1%, a difference of 0.18%).
| Demographics | Rating | Rank | Vision Disability |
| Chileans | 94.0 /100 | #109 | Exceptional 2.1% |
| Immigrants | Armenia | 93.8 /100 | #110 | Exceptional 2.1% |
| Peruvians | 93.5 /100 | #111 | Exceptional 2.1% |
| Immigrants | Denmark | 92.9 /100 | #112 | Exceptional 2.1% |
| Kenyans | 92.5 /100 | #113 | Exceptional 2.1% |
| Croatians | 92.3 /100 | #114 | Exceptional 2.1% |
| Immigrants | Vietnam | 92.2 /100 | #115 | Exceptional 2.1% |
| Ugandans | 92.2 /100 | #116 | Exceptional 2.1% |
| Poles | 92.0 /100 | #117 | Exceptional 2.1% |
| Immigrants | Philippines | 91.4 /100 | #118 | Exceptional 2.1% |
| Immigrants | Uganda | 91.4 /100 | #119 | Exceptional 2.1% |
| Immigrants | Zimbabwe | 91.0 /100 | #120 | Exceptional 2.1% |
| Immigrants | Scotland | 90.4 /100 | #121 | Exceptional 2.1% |
| Immigrants | Ukraine | 90.4 /100 | #122 | Exceptional 2.1% |
| Immigrants | Albania | 90.4 /100 | #123 | Exceptional 2.1% |
Demographics Similar to Immigrants from Eastern Europe by Vision Disability
In terms of vision disability, the demographic groups most similar to Immigrants from Eastern Europe are Paraguayan (2.0%, a difference of 0.030%), Immigrants from Jordan (2.0%, a difference of 0.030%), Palestinian (2.0%, a difference of 0.050%), Immigrants from North Macedonia (2.0%, a difference of 0.050%), and Immigrants from Eritrea (2.0%, a difference of 0.11%).
| Demographics | Rating | Rank | Vision Disability |
| Immigrants | Northern Europe | 98.6 /100 | #71 | Exceptional 2.0% |
| Immigrants | France | 98.5 /100 | #72 | Exceptional 2.0% |
| Immigrants | Eritrea | 98.4 /100 | #73 | Exceptional 2.0% |
| Palestinians | 98.3 /100 | #74 | Exceptional 2.0% |
| Immigrants | North Macedonia | 98.3 /100 | #75 | Exceptional 2.0% |
| Paraguayans | 98.3 /100 | #76 | Exceptional 2.0% |
| Immigrants | Jordan | 98.3 /100 | #77 | Exceptional 2.0% |
| Immigrants | Eastern Europe | 98.3 /100 | #78 | Exceptional 2.0% |
| Assyrians/Chaldeans/Syriacs | 98.1 /100 | #79 | Exceptional 2.0% |
| Lithuanians | 97.7 /100 | #80 | Exceptional 2.0% |
| Soviet Union | 97.6 /100 | #81 | Exceptional 2.0% |
| Immigrants | Poland | 97.6 /100 | #82 | Exceptional 2.0% |
| Immigrants | Western Asia | 97.5 /100 | #83 | Exceptional 2.0% |
| Immigrants | Latvia | 97.3 /100 | #84 | Exceptional 2.0% |
| Chinese | 97.2 /100 | #85 | Exceptional 2.0% |