Immigrants vs Asian Male Disability
COMPARE
Immigrants
Asian
Male Disability
Male Disability Comparison
Immigrants
Asians
10.8%
MALE DISABILITY
93.9/ 100
METRIC RATING
110th/ 347
METRIC RANK
10.0%
MALE DISABILITY
100.0/ 100
METRIC RATING
20th/ 347
METRIC RANK
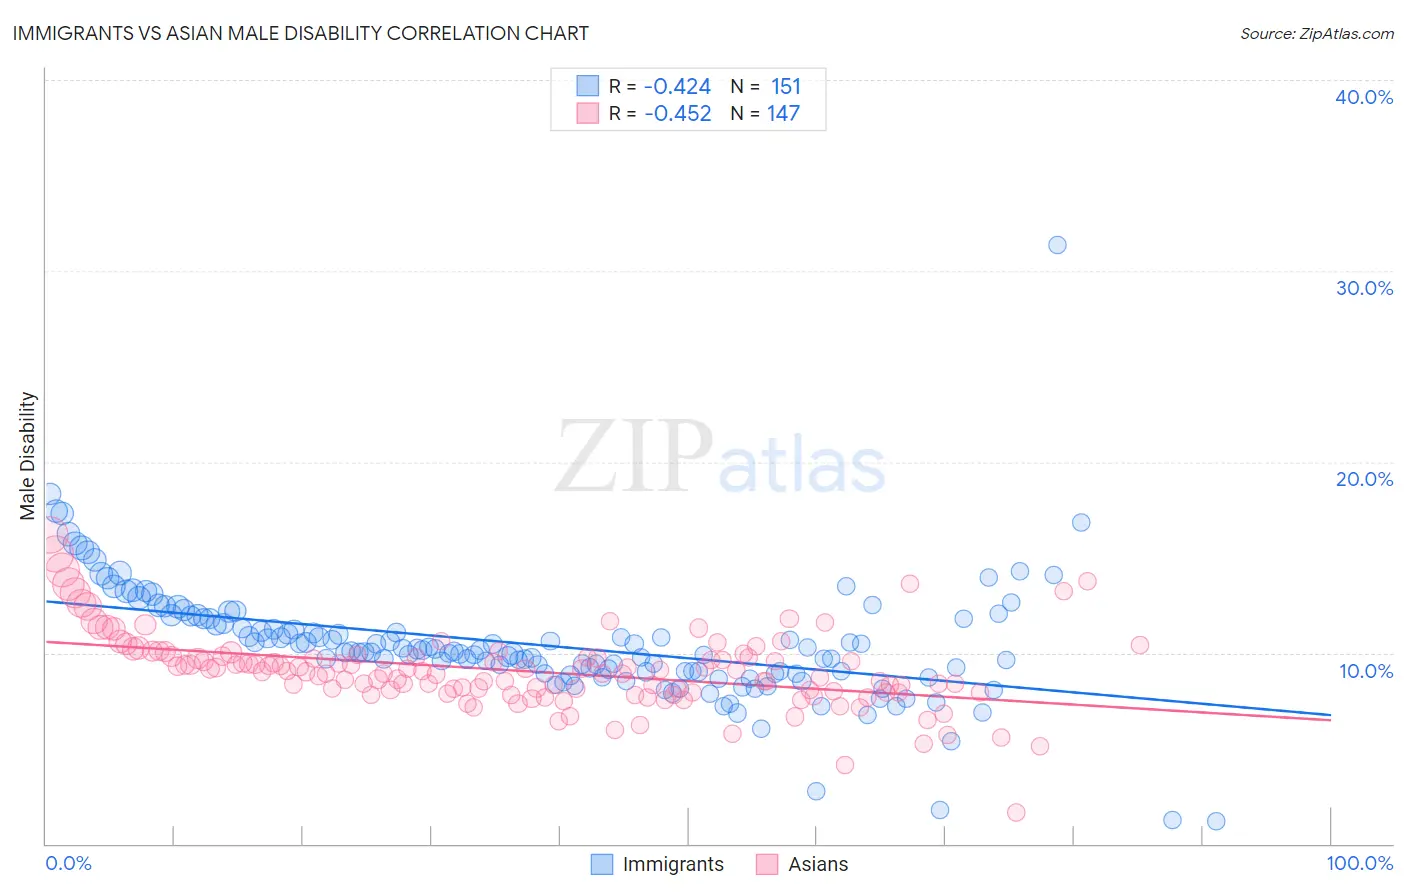
Immigrants vs Asian Male Disability Correlation Chart
The statistical analysis conducted on geographies consisting of 577,387,777 people shows a moderate negative correlation between the proportion of Immigrants and percentage of males with a disability in the United States with a correlation coefficient (R) of -0.424 and weighted average of 10.8%. Similarly, the statistical analysis conducted on geographies consisting of 550,680,295 people shows a moderate negative correlation between the proportion of Asians and percentage of males with a disability in the United States with a correlation coefficient (R) of -0.452 and weighted average of 10.0%, a difference of 8.3%.
Male Disability Correlation Summary
| Measurement | Immigrants | Asian |
| Minimum | 1.2% | 1.6% |
| Maximum | 31.4% | 16.2% |
| Range | 30.2% | 14.6% |
| Mean | 10.4% | 9.0% |
| Median | 10.0% | 9.0% |
| Interquartile 25% (IQ1) | 8.9% | 7.9% |
| Interquartile 75% (IQ3) | 11.8% | 9.8% |
| Interquartile Range (IQR) | 2.8% | 1.8% |
| Standard Deviation (Sample) | 3.2% | 2.0% |
| Standard Deviation (Population) | 3.2% | 2.0% |
Similar Demographics by Male Disability
Demographics Similar to Immigrants by Male Disability
In terms of male disability, the demographic groups most similar to Immigrants are Immigrants from Uganda (10.8%, a difference of 0.030%), Immigrants from Uruguay (10.8%, a difference of 0.040%), Immigrants from Belgium (10.8%, a difference of 0.080%), Immigrants from Eastern Africa (10.8%, a difference of 0.090%), and Ghanaian (10.8%, a difference of 0.14%).
| Demographics | Rating | Rank | Male Disability |
| Uruguayans | 95.3 /100 | #103 | Exceptional 10.7% |
| Immigrants | Nigeria | 95.1 /100 | #104 | Exceptional 10.8% |
| Immigrants | Brazil | 95.0 /100 | #105 | Exceptional 10.8% |
| Immigrants | Syria | 94.9 /100 | #106 | Exceptional 10.8% |
| Immigrants | Eastern Africa | 94.3 /100 | #107 | Exceptional 10.8% |
| Immigrants | Belgium | 94.2 /100 | #108 | Exceptional 10.8% |
| Immigrants | Uganda | 94.0 /100 | #109 | Exceptional 10.8% |
| Immigrants | Immigrants | 93.9 /100 | #110 | Exceptional 10.8% |
| Immigrants | Uruguay | 93.8 /100 | #111 | Exceptional 10.8% |
| Ghanaians | 93.4 /100 | #112 | Exceptional 10.8% |
| Immigrants | Zimbabwe | 93.0 /100 | #113 | Exceptional 10.8% |
| Central Americans | 92.7 /100 | #114 | Exceptional 10.8% |
| Immigrants | Barbados | 92.2 /100 | #115 | Exceptional 10.8% |
| Immigrants | South Africa | 91.8 /100 | #116 | Exceptional 10.8% |
| Eastern Europeans | 90.6 /100 | #117 | Exceptional 10.9% |
Demographics Similar to Asians by Male Disability
In terms of male disability, the demographic groups most similar to Asians are Immigrants from Sri Lanka (10.0%, a difference of 0.060%), Burmese (10.0%, a difference of 0.11%), Immigrants from Venezuela (10.0%, a difference of 0.39%), Cypriot (10.0%, a difference of 0.49%), and Immigrants from Asia (10.0%, a difference of 0.62%).
| Demographics | Rating | Rank | Male Disability |
| Iranians | 100.0 /100 | #13 | Exceptional 9.7% |
| Immigrants | Iran | 100.0 /100 | #14 | Exceptional 9.7% |
| Indians (Asian) | 100.0 /100 | #15 | Exceptional 9.7% |
| Okinawans | 100.0 /100 | #16 | Exceptional 9.8% |
| Immigrants | Korea | 100.0 /100 | #17 | Exceptional 9.8% |
| Immigrants | Pakistan | 100.0 /100 | #18 | Exceptional 9.8% |
| Immigrants | Sri Lanka | 100.0 /100 | #19 | Exceptional 10.0% |
| Asians | 100.0 /100 | #20 | Exceptional 10.0% |
| Burmese | 100.0 /100 | #21 | Exceptional 10.0% |
| Immigrants | Venezuela | 100.0 /100 | #22 | Exceptional 10.0% |
| Cypriots | 100.0 /100 | #23 | Exceptional 10.0% |
| Immigrants | Asia | 100.0 /100 | #24 | Exceptional 10.0% |
| Immigrants | Malaysia | 99.9 /100 | #25 | Exceptional 10.0% |
| Paraguayans | 99.9 /100 | #26 | Exceptional 10.1% |
| Egyptians | 99.9 /100 | #27 | Exceptional 10.1% |