Immigrants vs Immigrants from Denmark Male Disability
COMPARE
Immigrants
Immigrants from Denmark
Male Disability
Male Disability Comparison
Immigrants
Immigrants from Denmark
10.8%
MALE DISABILITY
93.9/ 100
METRIC RATING
110th/ 347
METRIC RANK
11.0%
MALE DISABILITY
76.4/ 100
METRIC RATING
149th/ 347
METRIC RANK
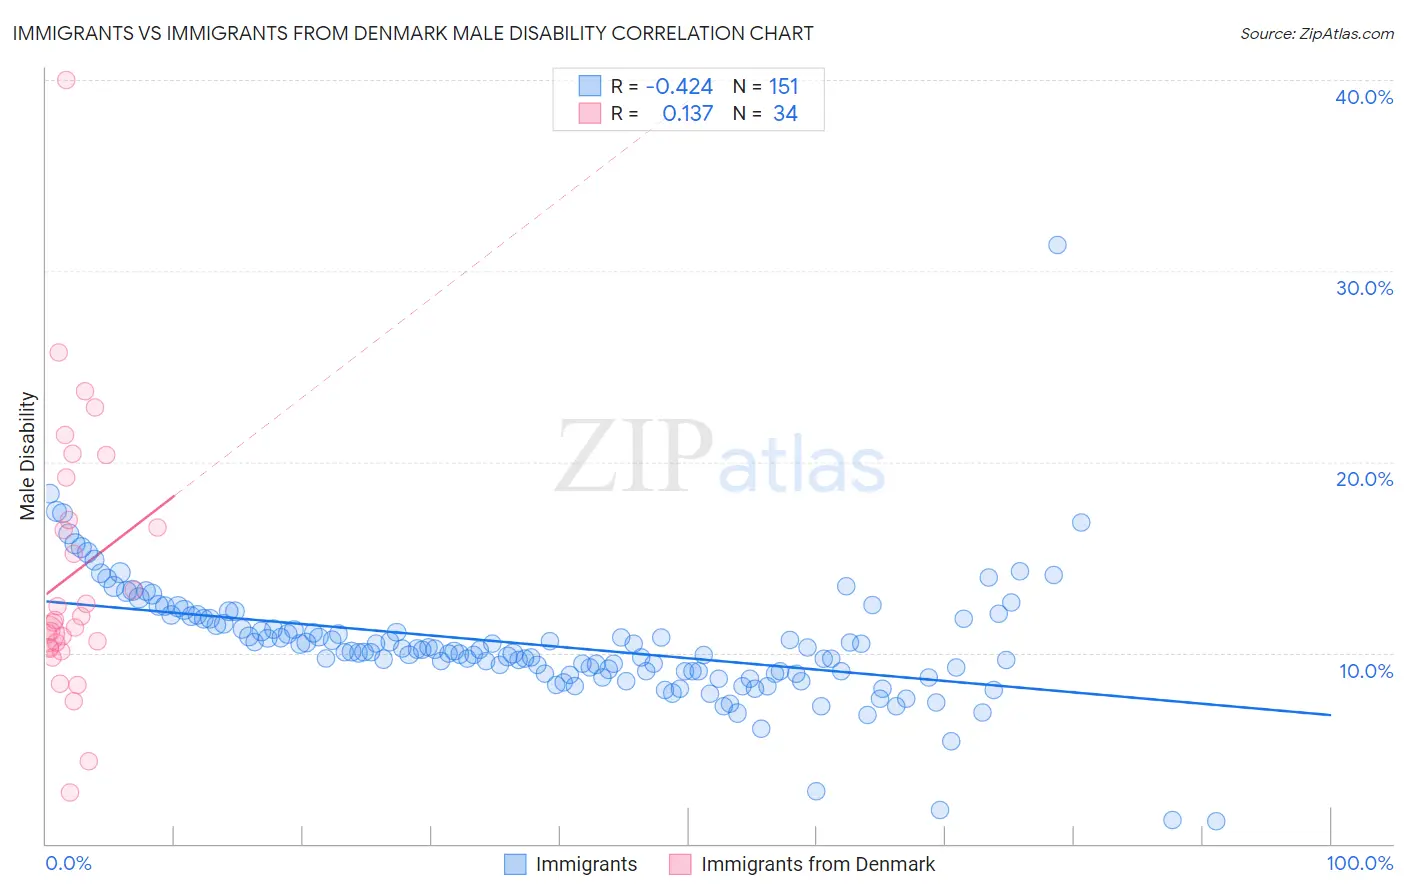
Immigrants vs Immigrants from Denmark Male Disability Correlation Chart
The statistical analysis conducted on geographies consisting of 577,387,777 people shows a moderate negative correlation between the proportion of Immigrants and percentage of males with a disability in the United States with a correlation coefficient (R) of -0.424 and weighted average of 10.8%. Similarly, the statistical analysis conducted on geographies consisting of 136,428,328 people shows a poor positive correlation between the proportion of Immigrants from Denmark and percentage of males with a disability in the United States with a correlation coefficient (R) of 0.137 and weighted average of 11.0%, a difference of 2.2%.
Male Disability Correlation Summary
| Measurement | Immigrants | Immigrants from Denmark |
| Minimum | 1.2% | 2.7% |
| Maximum | 31.4% | 40.0% |
| Range | 30.2% | 37.3% |
| Mean | 10.4% | 14.1% |
| Median | 10.0% | 11.7% |
| Interquartile 25% (IQ1) | 8.9% | 10.3% |
| Interquartile 75% (IQ3) | 11.8% | 17.0% |
| Interquartile Range (IQR) | 2.8% | 6.7% |
| Standard Deviation (Sample) | 3.2% | 7.1% |
| Standard Deviation (Population) | 3.2% | 7.0% |
Similar Demographics by Male Disability
Demographics Similar to Immigrants by Male Disability
In terms of male disability, the demographic groups most similar to Immigrants are Immigrants from Uganda (10.8%, a difference of 0.030%), Immigrants from Uruguay (10.8%, a difference of 0.040%), Immigrants from Belgium (10.8%, a difference of 0.080%), Immigrants from Eastern Africa (10.8%, a difference of 0.090%), and Ghanaian (10.8%, a difference of 0.14%).
| Demographics | Rating | Rank | Male Disability |
| Uruguayans | 95.3 /100 | #103 | Exceptional 10.7% |
| Immigrants | Nigeria | 95.1 /100 | #104 | Exceptional 10.8% |
| Immigrants | Brazil | 95.0 /100 | #105 | Exceptional 10.8% |
| Immigrants | Syria | 94.9 /100 | #106 | Exceptional 10.8% |
| Immigrants | Eastern Africa | 94.3 /100 | #107 | Exceptional 10.8% |
| Immigrants | Belgium | 94.2 /100 | #108 | Exceptional 10.8% |
| Immigrants | Uganda | 94.0 /100 | #109 | Exceptional 10.8% |
| Immigrants | Immigrants | 93.9 /100 | #110 | Exceptional 10.8% |
| Immigrants | Uruguay | 93.8 /100 | #111 | Exceptional 10.8% |
| Ghanaians | 93.4 /100 | #112 | Exceptional 10.8% |
| Immigrants | Zimbabwe | 93.0 /100 | #113 | Exceptional 10.8% |
| Central Americans | 92.7 /100 | #114 | Exceptional 10.8% |
| Immigrants | Barbados | 92.2 /100 | #115 | Exceptional 10.8% |
| Immigrants | South Africa | 91.8 /100 | #116 | Exceptional 10.8% |
| Eastern Europeans | 90.6 /100 | #117 | Exceptional 10.9% |
Demographics Similar to Immigrants from Denmark by Male Disability
In terms of male disability, the demographic groups most similar to Immigrants from Denmark are Sudanese (11.0%, a difference of 0.060%), Immigrants from Croatia (11.0%, a difference of 0.070%), Korean (11.0%, a difference of 0.090%), Immigrants from Guatemala (11.0%, a difference of 0.10%), and Cuban (11.0%, a difference of 0.12%).
| Demographics | Rating | Rank | Male Disability |
| Immigrants | Sudan | 81.5 /100 | #142 | Excellent 11.0% |
| Moroccans | 80.7 /100 | #143 | Excellent 11.0% |
| Kenyans | 78.1 /100 | #144 | Good 11.0% |
| Costa Ricans | 78.0 /100 | #145 | Good 11.0% |
| Koreans | 77.5 /100 | #146 | Good 11.0% |
| Immigrants | Croatia | 77.3 /100 | #147 | Good 11.0% |
| Sudanese | 77.1 /100 | #148 | Good 11.0% |
| Immigrants | Denmark | 76.4 /100 | #149 | Good 11.0% |
| Immigrants | Guatemala | 75.1 /100 | #150 | Good 11.0% |
| Cubans | 74.9 /100 | #151 | Good 11.0% |
| Immigrants | Albania | 74.4 /100 | #152 | Good 11.0% |
| Immigrants | Northern Europe | 73.2 /100 | #153 | Good 11.1% |
| Immigrants | Moldova | 72.8 /100 | #154 | Good 11.1% |
| Immigrants | Middle Africa | 70.9 /100 | #155 | Good 11.1% |
| Russians | 69.8 /100 | #156 | Good 11.1% |